

 This tutorial demonstrates how to create simple graphs in ROOT.
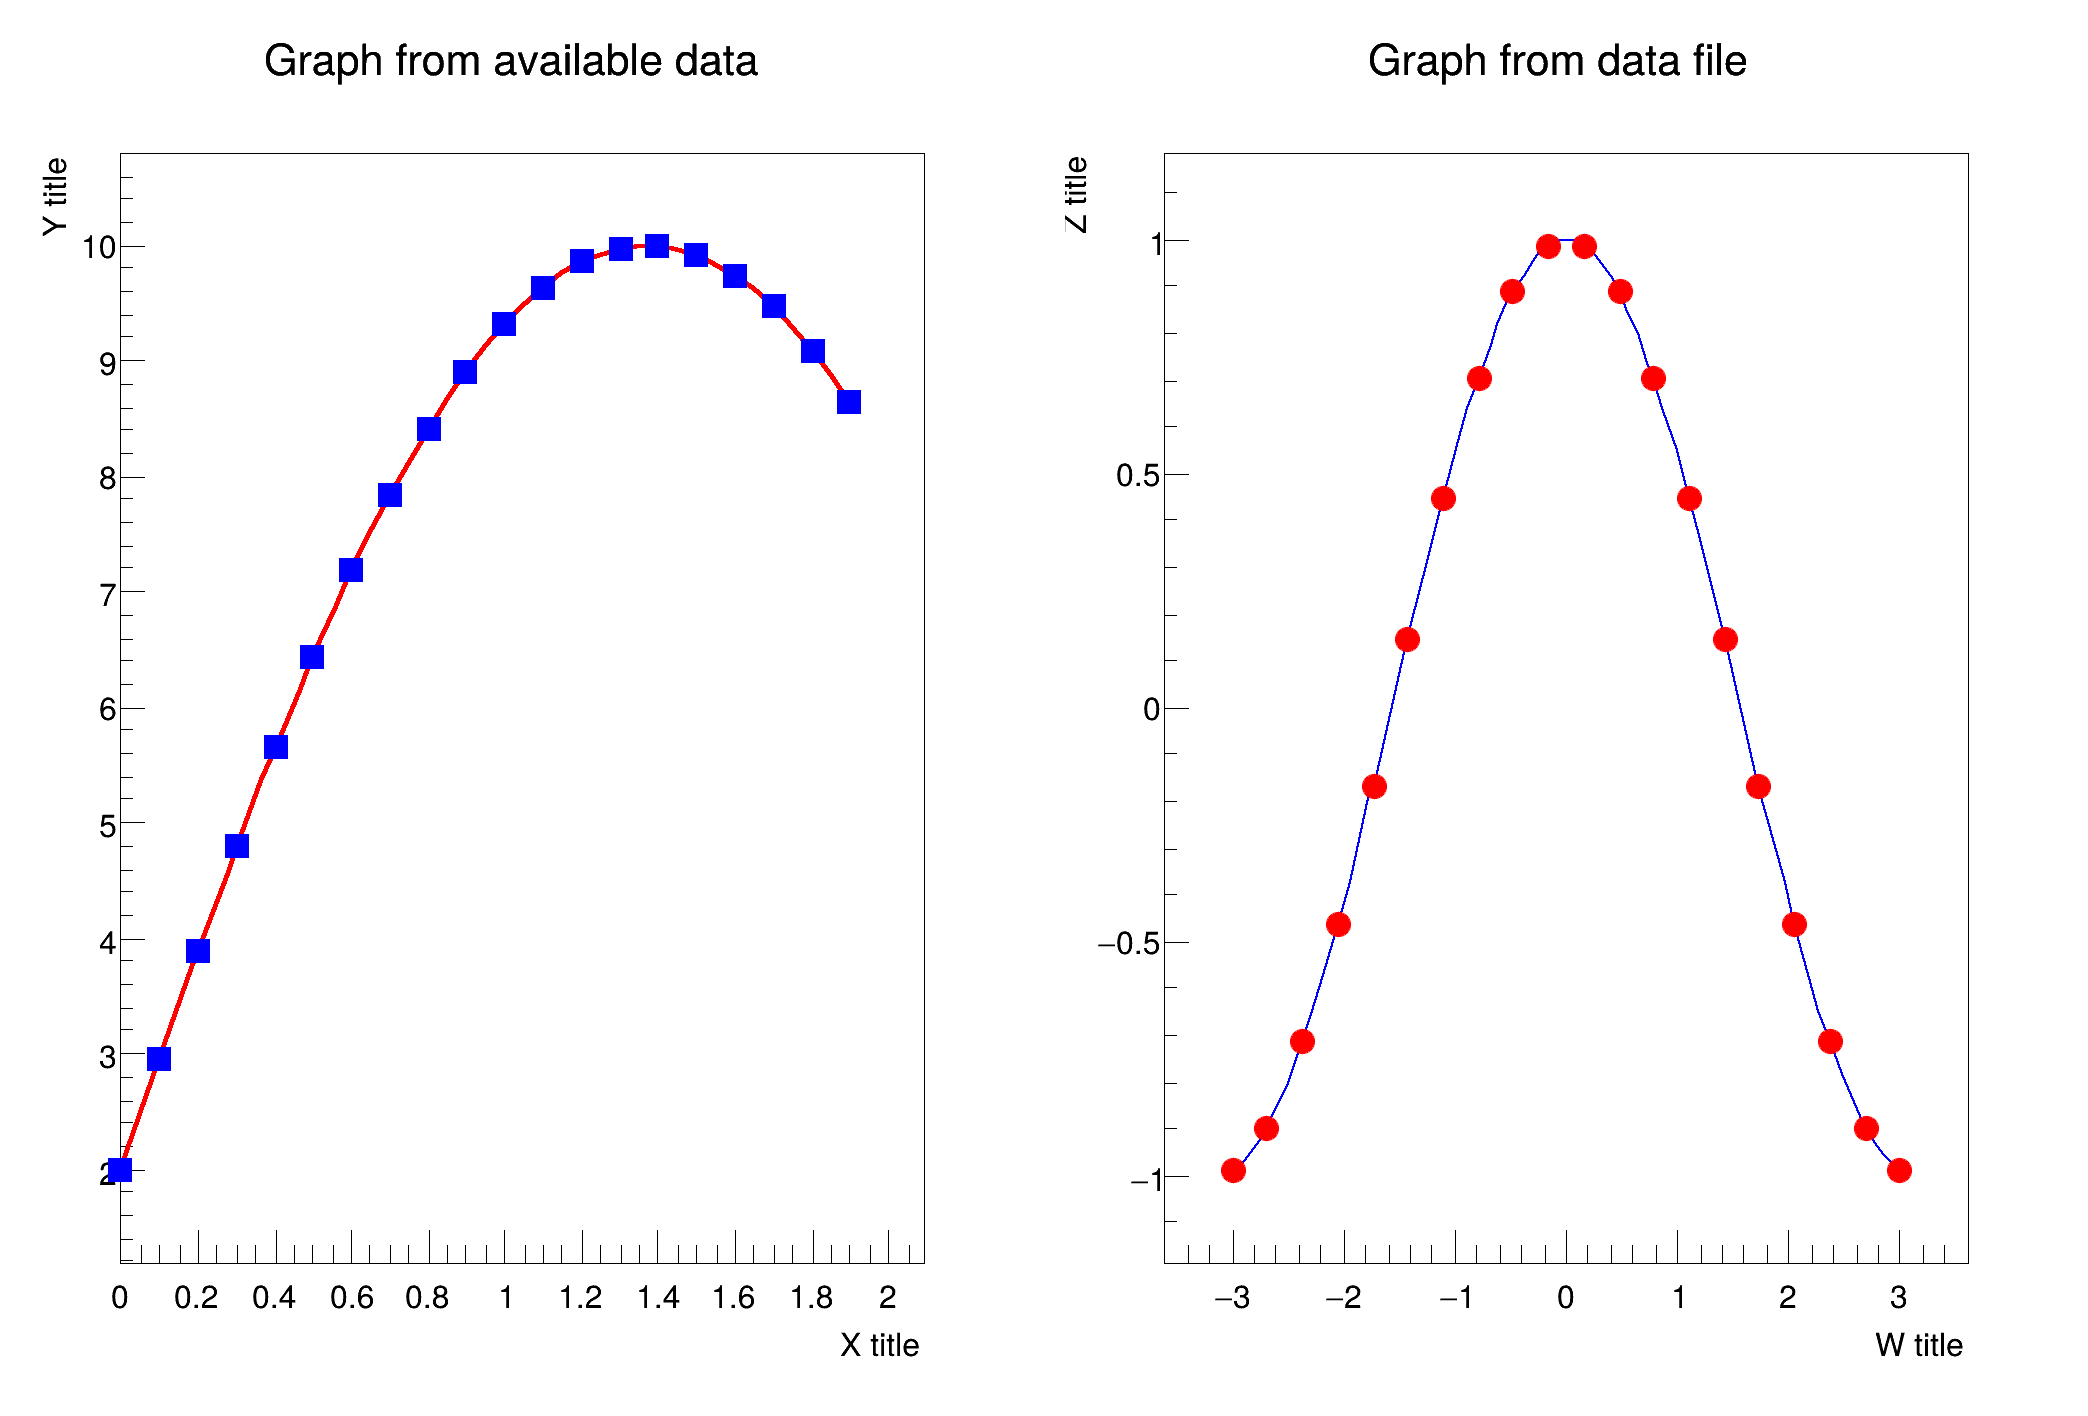
The example is divided into two sections:
- The first section plots data generated from arrays.
- The second section plots data read from a text file.
#include<fstream>
void gr001_simple() {
printf(
" i %i %f %f \n",i,
x[i],
y[i]);
}
gr1->
SetTitle(
"Graph from available data");
std::ifstream file(
gROOT->GetTutorialDir() +
"/visualisation/graphs/data_basic.txt");
for (
Int_t i = 0; i <
m; i++) {
printf(
" i %i %f %f \n",i,
w[i],z[i]);
}
file.close();
}
int Int_t
Signed integer 4 bytes (int).
double Double_t
Double 8 bytes.
Option_t Option_t TPoint TPoint const char GetTextMagnitude GetFillStyle GetLineColor GetLineWidth GetMarkerStyle GetTextAlign GetTextColor GetTextSize void w
virtual void SetLineWidth(Width_t lwidth)
Set the line width.
virtual void SetLineColor(Color_t lcolor)
Set the line color.
virtual void SetMarkerColor(Color_t mcolor=1)
Set the marker color.
virtual void SetMarkerStyle(Style_t mstyle=1)
Set the marker style.
void Draw(Option_t *chopt="") override
Default Draw method for all objects.
void SetTitle(const char *title="") override
Set the title of the TNamed.
virtual void SetTitle(const char *title="")
Set the title of the TNamed.
- Author
- Rene Brun
Definition in file gr001_simple.C.

