Logo ROOT  
Reference Guide
Loading...
Searching...
No Matches
chi2test.C File Reference

Detailed Description

View in nbviewer Open in SWAN
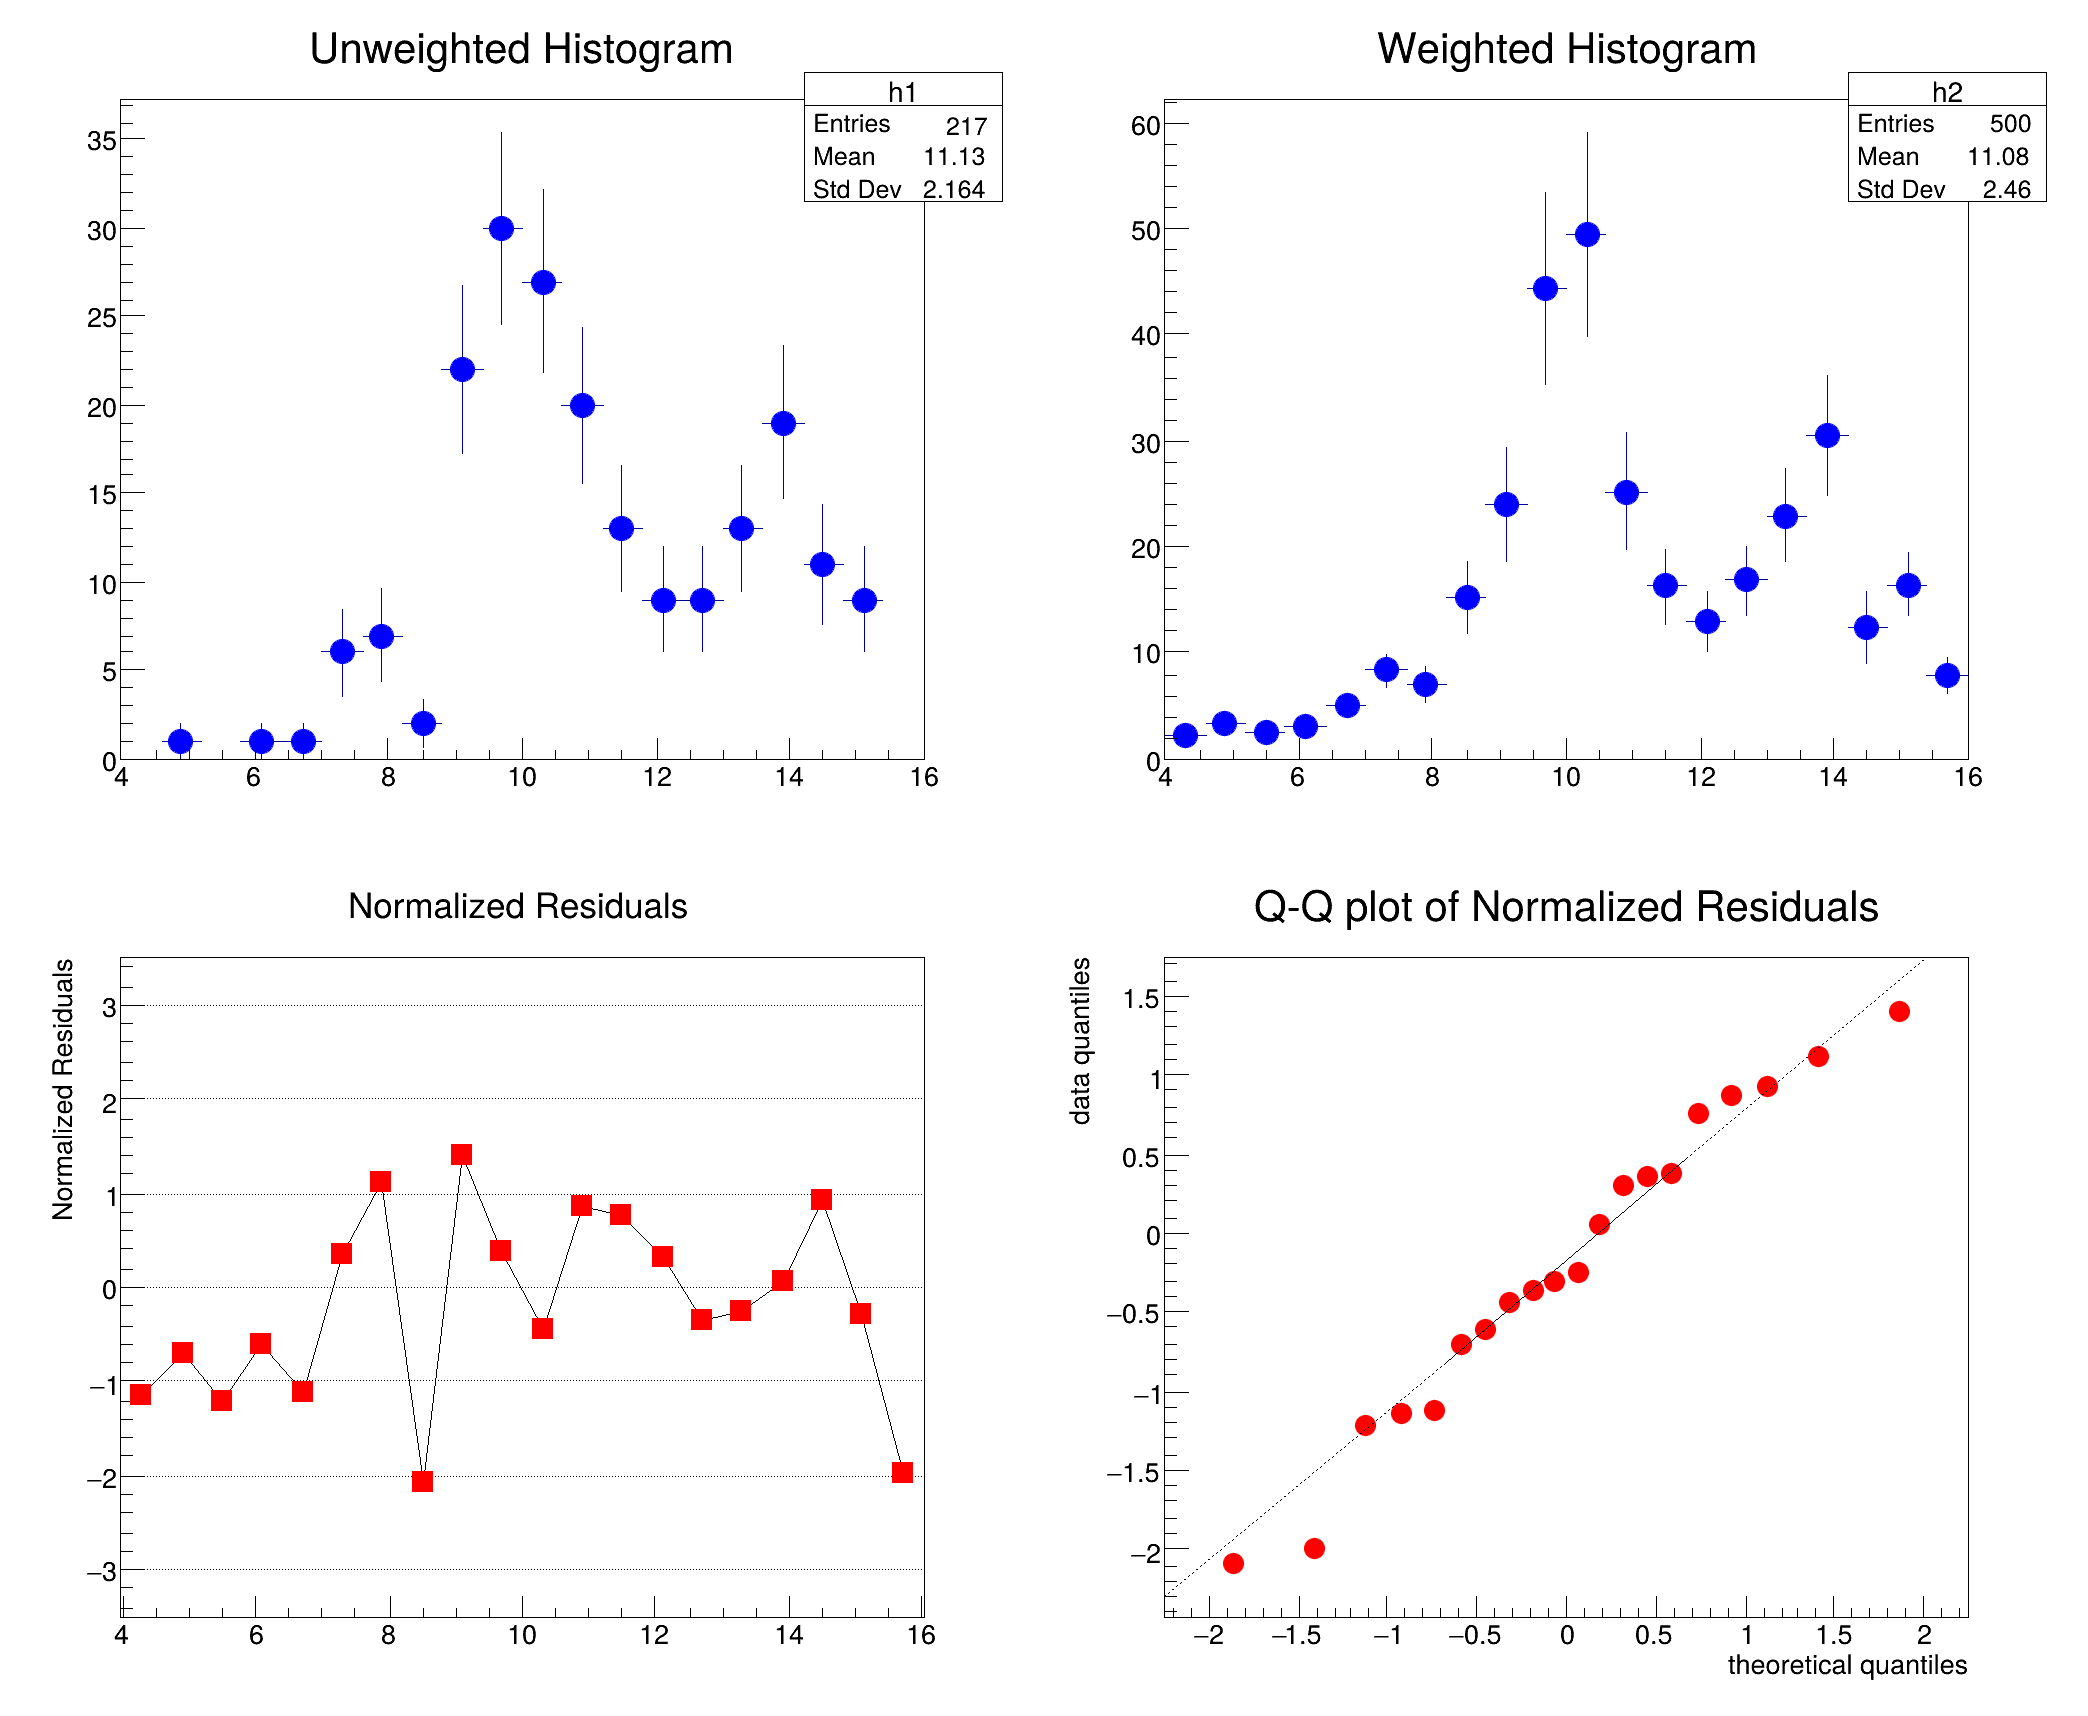
Example to use chi2 test for comparing two histograms.

One unweighted histogram is compared with a weighted histogram. The normalized residuals are retrieved and plotted in a simple graph. The QQ plot of the normalized residual using the normal distribution is also plotted.

Chi2 = 21.085124, Prob = 0.332116, NDF = 19, igood = 1
(TCanvas *) 0x5613821078d0
#include "TH1.h"
#include "TH1D.h"
#include "TF1.h"
#include "TGraph.h"
#include "TGraphQQ.h"
#include "TCanvas.h"
#include "TStyle.h"
#include "TMath.h"
TCanvas * chi2test(Float_t w=0)
{
// Note: The parameter w is used to produce the 2 pictures in
// the TH1::Chi2Test method. The 1st picture is produced with
// w=0 and the 2nd with w=17 (see TH1::Chi2Test() help).
// Define Histograms.
const Int_t n = 20;
TH1D *h1 = new TH1D("h1", "h1", n, 4, 16);
TH1D *h2 = new TH1D("h2", "h2", n, 4, 16);
h1->SetTitle("Unweighted Histogram");
h2->SetTitle("Weighted Histogram");
h1->SetBinContent(1, 0);
h1->SetBinContent(2, 1);
h1->SetBinContent(3, 0);
h1->SetBinContent(4, 1);
h1->SetBinContent(5, 1);
h1->SetBinContent(6, 6);
h1->SetBinContent(7, 7);
h1->SetBinContent(8, 2);
h1->SetBinContent(9, 22);
h1->SetBinContent(10, 30);
h1->SetBinContent(11, 27);
h1->SetBinContent(12, 20);
h1->SetBinContent(13, 13);
h1->SetBinContent(14, 9);
h1->SetBinContent(15, 9 + w);
h1->SetBinContent(16, 13);
h1->SetBinContent(17, 19);
h1->SetBinContent(18, 11);
h1->SetBinContent(19, 9);
h1->SetBinContent(20, 0);
h2->SetBinContent(1, 2.20173025 );
h2->SetBinContent(2, 3.30143857);
h2->SetBinContent(3, 2.5892849);
h2->SetBinContent(4, 2.99990201);
h2->SetBinContent(5, 4.92877054);
h2->SetBinContent(6, 8.33036995);
h2->SetBinContent(7, 6.95084763);
h2->SetBinContent(8, 15.206357);
h2->SetBinContent(9, 23.9236012);
h2->SetBinContent(10, 44.3848114);
h2->SetBinContent(11, 49.4465599);
h2->SetBinContent(12, 25.1868858);
h2->SetBinContent(13, 16.3129692);
h2->SetBinContent(14, 13.0289612);
h2->SetBinContent(15, 16.7857609);
h2->SetBinContent(16, 22.9914703);
h2->SetBinContent(17, 30.5279255);
h2->SetBinContent(18, 12.5252123);
h2->SetBinContent(19, 16.4104557);
h2->SetBinContent(20, 7.86067867);
h2->SetBinError(1, 0.38974303 );
h2->SetBinError(2, 0.536510944);
h2->SetBinError(3, 0.529702604);
h2->SetBinError(4, 0.642001867);
h2->SetBinError(5, 0.969341516);
h2->SetBinError(6, 1.47611344);
h2->SetBinError(7, 1.69797957);
h2->SetBinError(8, 3.28577447);
h2->SetBinError(9, 5.40784931);
h2->SetBinError(10, 9.10106468);
h2->SetBinError(11, 9.73541737);
h2->SetBinError(12, 5.55019951);
h2->SetBinError(13, 3.57914758);
h2->SetBinError(14, 2.77877331);
h2->SetBinError(15, 3.23697519);
h2->SetBinError(16, 4.3608489);
h2->SetBinError(17, 5.77172089);
h2->SetBinError(18, 3.38666105);
h2->SetBinError(19, 2.98861837);
h2->SetBinError(20, 1.58402085);
h1->SetEntries(217);
h2->SetEntries(500);
//apply the chi2 test and retrieve the residuals
Double_t res[n], x[20];
h1->Chi2Test(h2,"UW P",res);
//Graph for Residuals
for (Int_t i=0; i<n; i++) x[i]= 4.+i*12./20.+12./40.;
TGraph *resgr = new TGraph(n,x,res);
resgr->GetXaxis()->SetRangeUser(4,16);
resgr->GetYaxis()->SetRangeUser(-3.5,3.5);
resgr->GetYaxis()->SetTitle("Normalized Residuals");
resgr->SetMarkerStyle(21);
resgr->SetMarkerColor(2);
resgr->SetMarkerSize(.9);
resgr->SetTitle("Normalized Residuals");
//Quantile-Quantile plot
TF1 *f = new TF1("f","TMath::Gaus(x,0,1)",-10,10);
TGraphQQ *qqplot = new TGraphQQ(n,res,f);
qqplot->SetMarkerStyle(20);
qqplot->SetMarkerColor(2);
qqplot->SetMarkerSize(.9);
qqplot->SetTitle("Q-Q plot of Normalized Residuals");
//create Canvas
TCanvas *c1 = new TCanvas("c1","Chistat Plot",10,10,700,600);
c1->Divide(2,2);
// Draw Histogramms and Graphs
c1->cd(1);
h1->SetMarkerColor(4);
h1->SetMarkerStyle(20);
h1->Draw("E");
c1->cd(2);
h2->Draw("");
h2->SetMarkerStyle(20);
c1->cd(3);
gPad->SetGridy();
resgr->Draw("APL");
c1->cd(4);
qqplot->Draw("AP");
c1->cd(0);
c1->Update();
return c1;
}
#define f(i)
Definition RSha256.hxx:104
int Int_t
Signed integer 4 bytes (int).
Definition RtypesCore.h:59
double Double_t
Double 8 bytes.
Definition RtypesCore.h:73
float Float_t
Float 4 bytes (float).
Definition RtypesCore.h:71
#define gPad
virtual void SetMarkerColor(Color_t mcolor=1)
Set the marker color.
Definition TAttMarker.h:41
virtual void SetMarkerStyle(Style_t mstyle=1)
Set the marker style.
Definition TAttMarker.h:43
virtual void SetMarkerSize(Size_t msize=1)
Set the marker size.
Definition TAttMarker.h:48
virtual void SetRangeUser(Double_t ufirst, Double_t ulast)
Set the viewing range for the axis from ufirst to ulast (in user coordinates, that is,...
Definition TAxis.cxx:1090
The Canvas class.
Definition TCanvas.h:23
Definition TF1.h:182
This class allows to draw quantile-quantile plots.
Definition TGraphQQ.h:18
void Draw(Option_t *chopt="") override
Default Draw method for all objects.
TAxis * GetXaxis() const
TAxis * GetYaxis() const
void SetTitle(const char *title="") override
Set the title of the TNamed.
1-D histogram with a double per channel (see TH1 documentation)
Definition TH1.h:926
void SetTitle(const char *title) override
Change/set the title.
Definition TH1.cxx:6836
virtual void SetBinError(Int_t bin, Double_t error)
Set the bin Error Note that this resets the bin eror option to be of Normal Type and for the non-empt...
Definition TH1.cxx:9340
void Draw(Option_t *option="") override
Draw this histogram with options.
Definition TH1.cxx:3097
virtual void SetBinContent(Int_t bin, Double_t content)
Set bin content see convention for numbering bins in TH1::GetBin In case the bin number is greater th...
Definition TH1.cxx:9356
virtual void SetEntries(Double_t n)
Definition TH1.h:639
virtual void SetTitle(const char *title="")
Set the title of the TNamed.
Definition TNamed.cxx:173
return c1
Definition legend1.C:41
Double_t x[n]
Definition legend1.C:17
const Int_t n
Definition legend1.C:16
TH1F * h1
Definition legend1.C:5
Author
Nikolai Gagunashvili, Daniel Haertl, Lorenzo Moneta

Definition in file chi2test.C.