Hello,

following problem with root 3.01

I have a large NTuple with values r, z, phi, .... called 'map'

if I plot

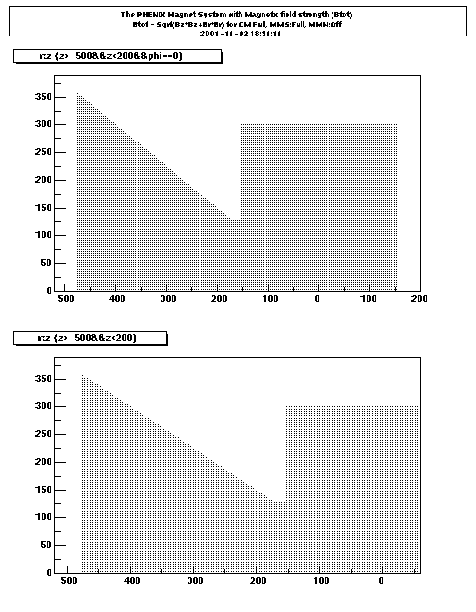
'map.Draw("r:z","z>-500&&z<200")' and

'map.Draw("r:z","z>-500&&z<200&&phi==0")'

the resulting range in 'z' is different! the first results in z<80 but the
other has z<150.

How can restricting the selection of plotted points make the range larger
??

==========================================================================
Achim Franz       Achim@bnl.gov         http://www.phenix.bnl.gov/~afranz/
BNL, Physics Dept., Bld 510C, Upton, New York, 11973-5000, USA
Tel.: +1 631 344 4750; Fax: +1 631 344 3253
Short messages (<120 char) to my cell phone: Achim_phone@mlp.rhic.bnl.gov
==========================================================================

This archive was generated by hypermail 2b29 : Tue Jan 01 2002 - 17:51:06 MET