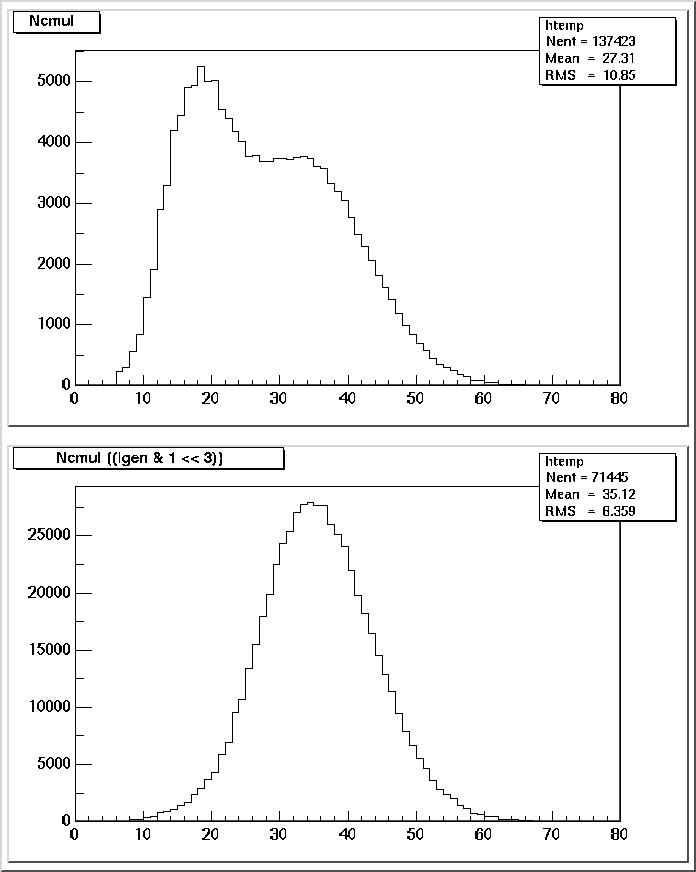
The  problem is even worst. See the  the plots attached, produced with
the commands

root>TChain chain("h1")
root>chain.Add("$SCRATCH_WEEK/*.root")
root> TCanvs ...
root> h1->Draw("Ncmul")
root>c->cd(2)
root>h1->Draw("Ncmul","Igen  & 1 << 3")

I took off some commands...  See the scales of both plots, they  are wrong.

Some  idea?

Thanks.
Luiz

This archive was generated by hypermail 2b29 : Tue Jan 01 2002 - 17:50:58 MET