Hello,
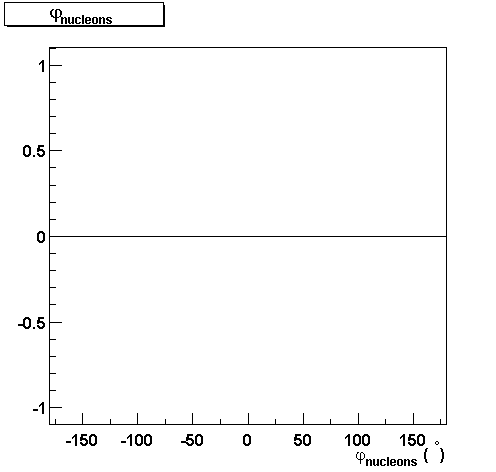
	I have a problem in showing correctly the #varphi simbol in an eps
file created from a histogram on a canvas. I have attached a macro
together with the gif (correct) and eps (incorrect) files produced from
the File menu.

I am using:

ROOT Version 3.01/04,  6 June 2001 (I updated to the head today!)
CINT/ROOT C/C++ Interpreter version 5.15.02, June 2 2001
Linux gcc version egcs-2.91.66 19990314/Linux (egcs-1.1.2 release)

I saw the same problem in ROOT version 3.00.05

Thanks for your help,

		Isidro


+---------------------------+--------------------------------+
| Isidro González Caballero | mailto:Isidro.Gonzalez@cern.ch |
| CERN-EP / Mailbox: F28010 | http://home.cern.ch/~iglez/    |
| 1211 Geneva 23            |               -o-              |
| Switzerland               | Tel: +41 22 76 73060, 73316    |
+---------------------------+--------------------------------+


{
//=========Macro generated from canvas: phi/phi
//=========  (Wed Jun  6 12:45:58 2001) by ROOT version3.01/04
   TCanvas *phi = new TCanvas("phi", "phi",20,20,500,500);
   phi->Range(-225,-1.37563,225,1.38063);
   phi->SetFillColor(0);
   phi->SetBorderMode(0);
   phi->SetBorderSize(2);
   phi->SetFrameFillColor(0);
   phi->SetFrameBorderMode(0);

   TH1 *Phinucleons = new TH1D("Phinucleons","#varphi_{nucleons}",360,-180,180);
   Phinucleons->SetStats(0);
   Phinucleons->SetFillColor(7);
   Phinucleons->GetXaxis()->SetTitle("#varphi_{nucleons} ( ^{#circ})");
   Phinucleons->Draw("");

   TPaveText *pt = new TPaveText(0.01,0.945,0.33,0.995,"blNDC");
   pt->SetBorderSize(2);
   TText *text = pt->AddText("#varphi_{nucleons}");
   pt->Draw();
   phi->Modified();
   phi->cd();
}

This archive was generated by hypermail 2b29 : Tue Jan 01 2002 - 17:50:48 MET