ROOT
6.07/09
Reference Guide
ROOT Home Page
Main Page
Tutorials
User's Classes
Namespaces
All Classes
Files
Release Notes
File List
File Members
tutorials
graphs
waves.C File Reference
Tutorials
»
Graphs tutorials
Detailed Description
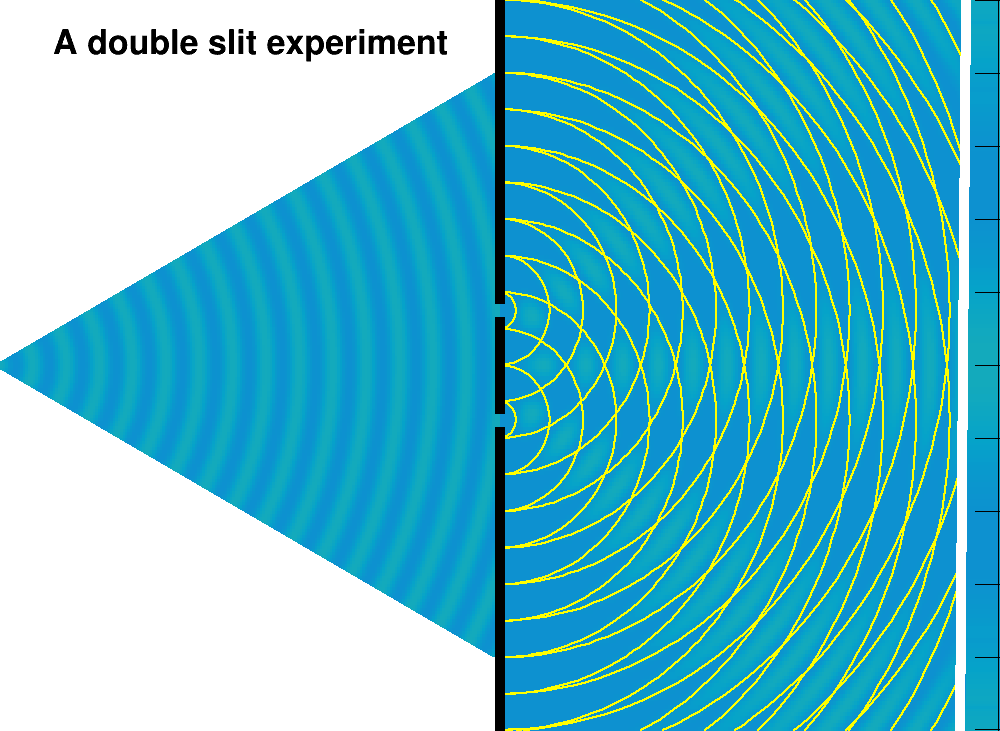
Hint: Spherical waves
#include "
TROOT.h
"
#include "
TCanvas.h
"
#include "
TColor.h
"
#include "
TArc.h
"
#include "
TGraph.h
"
#include "
TF2.h
"
#include "
TLine.h
"
#include "
TLatex.h
"
#include "
TMath.h
"
#include "
TStyle.h
"
#include "
Riostream.h
"
TF2
* finter;
//______________________________________________________________
Double_t
interference(
Double_t
*x,
Double_t
*par)
{
Double_t
x_p2 = x[0] * x[0];
Double_t
d_2 = 0.5 * par[2];
Double_t
ym_p2 = (x[1] - d_2) * (x[1] - d_2);
Double_t
yp_p2 = (x[1] + d_2) * (x[1] + d_2);
Double_t
tpi_l =
TMath::Pi
() / par[1];
Double_t
amplitude = par[0] * (
cos
(tpi_l *
sqrt
(x_p2 + ym_p2))
+ par[3] *
cos
(tpi_l *
sqrt
(x_p2 + yp_p2)));
return
amplitude * amplitude;
}
//_____________________________________________________________
Double_t
result
(
Double_t
*x,
Double_t
*par)
{
Double_t
xint[2];
Double_t
maxintens = 0, xcur = 14;
Double_t
dlambda = 0.1 * par[1];
for
(
Int_t
i=0; i<10; i++){
xint[0] = xcur;
xint[1] = x[1];
Double_t
intens = interference(xint, par);
if
(intens > maxintens) maxintens = intens;
xcur -= dlambda;
}
return
maxintens;
}
//_____________________________________________________________
void
waves(
Double_t
d = 3,
Double_t
lambda = 1,
Double_t
amp = 10)
{
TCanvas
*c1 =
new
TCanvas
(
"waves"
,
"A double slit experiment"
,
300,40, 1004, 759);
c1->
Range
(0, -10, 30, 10);
c1->
SetFillColor
(0);
TPad
*pad =
new
TPad
(
"pr"
,
"pr"
, 0.5, 0 , 1., 1);
pad->
Range
(0, -10, 15, 10);
pad->
Draw
();
const
Int_t
colNum = 30;
Int_t
palette[colNum];
for
(
Int_t
i=0;i<colNum;i++) {
TColor
*color =
new
TColor
(1001+i
,
pow
(i/((colNum)*1.0),0.3)
,
pow
(i/((colNum)*1.0),0.3)
,0.5*(i/((colNum)*1.0)),
""
);
palette[i] = 1001+i;
}
gStyle
->
SetPalette
(colNum,palette);
c1->
cd
();
TF2
* f0 =
new
TF2
(
"ray_source"
,interference, 0.02, 15, -8, 8, 4);
f0->
SetParameters
(amp, lambda, 0, 0);
f0->
SetNpx
(200);
f0->
SetNpy
(200);
f0->
SetContour
(colNum-2);
f0->
Draw
(
"samecolz"
);
TLatex
title;
title.
DrawLatex
(1.6, 8.5,
"A double slit experiment"
);
TGraph
*graph =
new
TGraph
(4);
graph->
SetFillColor
(0);
graph->
SetFillStyle
(1001);
graph->
SetLineWidth
(0);
graph->
SetPoint
(0, 0., 0.1);
graph->
SetPoint
(1, 14.8, 8);
graph->
SetPoint
(2, 0, 8);
graph->
SetPoint
(3, 0, 0.1);
graph->
Draw
(
"F"
);
graph =
new
TGraph
(4);
graph->
SetFillColor
(0);
graph->
SetFillStyle
(1001);
graph->
SetLineWidth
(0);
graph->
SetPoint
(0, 0, -0.1);
graph->
SetPoint
(1, 14.8, -8);
graph->
SetPoint
(2, 0, -8);
graph->
SetPoint
(3, 0, -0.1);
graph->
Draw
(
"F"
);
TLine
*
line
;
line =
new
TLine
(15,-10, 15, 0 - 0.5*d -0.2);
line->
SetLineWidth
(10); line->
Draw
();
line =
new
TLine
(15, 0 - 0.5*d +0.2 ,15, 0 + 0.5*d -0.2);
line->
SetLineWidth
(10); line->
Draw
();
line =
new
TLine
(15,0 + 0.5*d + 0.2,15, 10);
line->
SetLineWidth
(10); line->
Draw
();
pad ->
cd
();
finter =
new
TF2
(
"interference"
,interference, 0.01, 14, -10, 10, 4);
finter->
SetParameters
(amp, lambda, d, 1);
finter->
SetNpx
(200);
finter->
SetNpy
(200);
finter->
SetContour
(colNum-2);
finter->
Draw
(
"samecolorz"
);
TArc
*arc =
new
TArc
();;
arc->
SetFillStyle
(0);
arc->
SetLineWidth
(2);
arc->
SetLineColor
(5);
Float_t
r = 0.5 * lambda, dr = lambda;
for
(
Int_t
i = 0; i < 16; i++) {
arc->
DrawArc
(0, 0.5*d, r, 0., 360.,
"only"
);
arc->
DrawArc
(0, -0.5*d, r, 0., 360.,
"only"
);
r += dr;
}
pad ->
cd
();
TF2
* fresult =
new
TF2
(
"result"
,result, 14, 15, -10, 10, 4);
fresult->
SetParameters
(amp, lambda, d, 1);
fresult->
SetNpx
(300);
fresult->
SetNpy
(300);
fresult->
SetContour
(colNum-2);
fresult->
Draw
(
"samecolor"
);
line =
new
TLine
(13.8,-10, 14, 10);
line->
SetLineWidth
(10); line->
SetLineColor
(0); line->
Draw
();
c1->
Modified
(
kTRUE
);
c1->
Update
();
c1->
SetEditable
(
kTRUE
);
}
Author
Otto Schaile
Definition in file
waves.C
.


 ROOT 6.07/09 - Reference Guide Generated on Wed Oct 19 2016 02:15:35 using Doxygen 1.8.12.

