Logo ROOT   6.07/09
Reference Guide
rf311_rangeplot.C File Reference

Detailed Description

View in nbviewer Open in SWAN 'MULTIDIMENSIONAL MODELS' RooFit tutorial macro #310

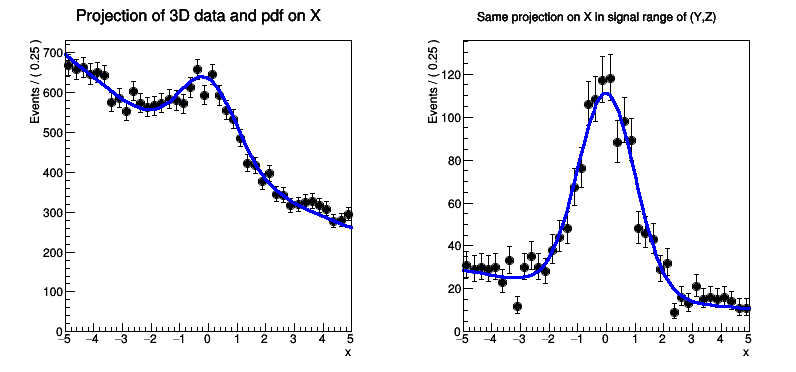
Projecting p.d.f and data ranges in continuous observables

pict1_rf311_rangeplot.C.png
Processing /mnt/vdb/lsf/workspace/root-makedoc-v608/rootspi/rdoc/src/v6-08-00-patches/tutorials/roofit/rf311_rangeplot.C...
RooFit v3.60 -- Developed by Wouter Verkerke and David Kirkby
Copyright (C) 2000-2013 NIKHEF, University of California & Stanford University
All rights reserved, please read http://roofit.sourceforge.net/license.txt
[#1] INFO:Plotting -- RooAbsReal::plotOn(model) plot on x integrates over variables (y,z)
[#1] INFO:Eval -- RooRealVar::setRange(y) new range named 'sigRegion' created with bounds [-1,1]
[#1] INFO:Eval -- RooRealVar::setRange(z) new range named 'sigRegion' created with bounds [-1,1]
[#1] INFO:Plotting -- RooTreeData::plotOn: plotting 1692 events out of 20000 total events
[#1] INFO:Plotting -- RooAbsReal::plotOn(model) plot on x integrates over variables (y,z) in range sigRegion
#include "RooRealVar.h"
#include "RooDataSet.h"
#include "RooGaussian.h"
#include "RooConstVar.h"
#include "RooProdPdf.h"
#include "RooAddPdf.h"
#include "RooPolynomial.h"
#include "TCanvas.h"
#include "TAxis.h"
#include "RooPlot.h"
using namespace RooFit ;
void rf311_rangeplot()
{
// C r e a t e 3 D p d f a n d d a t a
// -------------------------------------------
// Create observables
RooRealVar x("x","x",-5,5) ;
RooRealVar y("y","y",-5,5) ;
RooRealVar z("z","z",-5,5) ;
// Create signal pdf gauss(x)*gauss(y)*gauss(z)
RooGaussian gx("gx","gx",x,RooConst(0),RooConst(1)) ;
RooGaussian gy("gy","gy",y,RooConst(0),RooConst(1)) ;
RooGaussian gz("gz","gz",z,RooConst(0),RooConst(1)) ;
RooProdPdf sig("sig","sig",RooArgSet(gx,gy,gz)) ;
// Create background pdf poly(x)*poly(y)*poly(z)
RooPolynomial px("px","px",x,RooArgSet(RooConst(-0.1),RooConst(0.004))) ;
RooPolynomial py("py","py",y,RooArgSet(RooConst(0.1),RooConst(-0.004))) ;
RooPolynomial pz("pz","pz",z) ;
RooProdPdf bkg("bkg","bkg",RooArgSet(px,py,pz)) ;
// Create composite pdf sig+bkg
RooRealVar fsig("fsig","signal fraction",0.1,0.,1.) ;
RooAddPdf model("model","model",RooArgList(sig,bkg),fsig) ;
RooDataSet* data = model.generate(RooArgSet(x,y,z),20000) ;
// P r o j e c t p d f a n d d a t a o n x
// -------------------------------------------------
// Make plain projection of data and pdf on x observable
RooPlot* frame = x.frame(Title("Projection of 3D data and pdf on X"),Bins(40)) ;
data->plotOn(frame) ;
model.plotOn(frame) ;
// P r o j e c t p d f a n d d a t a o n x i n s i g n a l r a n g e
// ----------------------------------------------------------------------------------
// Define signal region in y and z observables
y.setRange("sigRegion",-1,1) ;
z.setRange("sigRegion",-1,1) ;
// Make plot frame
RooPlot* frame2 = x.frame(Title("Same projection on X in signal range of (Y,Z)"),Bins(40)) ;
// Plot subset of data in which all observables are inside "sigRegion"
// For observables that do not have an explicit "sigRegion" range defined (e.g. observable)
// an implicit definition is used that is identical to the full range (i.e. [-5,5] for x)
data->plotOn(frame2,CutRange("sigRegion")) ;
// Project model on x, integrating projected observables (y,z) only in "sigRegion"
model.plotOn(frame2,ProjectionRange("sigRegion")) ;
TCanvas* c = new TCanvas("rf311_rangeplot","rf310_rangeplot",800,400) ;
c->Divide(2) ;
c->cd(1) ; gPad->SetLeftMargin(0.15) ; frame->GetYaxis()->SetTitleOffset(1.4) ; frame->Draw() ;
c->cd(2) ; gPad->SetLeftMargin(0.15) ; frame2->GetYaxis()->SetTitleOffset(1.4) ; frame2->Draw() ;
}
Author
07/2008 - Wouter Verkerke

Definition in file rf311_rangeplot.C.