Processing /mnt/vdb/lsf/workspace/root-makedoc-v608/rootspi/rdoc/src/v6-08-00-patches/tutorials/roofit/rf107_plotstyles.C...
�[1mRooFit v3.60 -- Developed by Wouter Verkerke and David Kirkby�[0m
Copyright (C) 2000-2013 NIKHEF, University of California & Stanford University
All rights reserved, please read http://roofit.sourceforge.net/license.txt
[#1] INFO:Minization -- RooMinimizer::optimizeConst: activating const optimization
**********
** 1 **SET PRINT 1
**********
**********
** 2 **SET NOGRAD
**********
PARAMETER DEFINITIONS:
NO. NAME VALUE STEP SIZE LIMITS
1 mean -3.00000e+00 2.00000e+00 -1.00000e+01 1.00000e+01
2 sigma 3.00000e+00 9.90000e-01 1.00000e-01 1.00000e+01
**********
** 3 **SET ERR 0.5
**********
**********
** 4 **SET PRINT 1
**********
**********
** 5 **SET STR 1
**********
NOW USING STRATEGY 1: TRY TO BALANCE SPEED AGAINST RELIABILITY
**********
** 6 **MIGRAD 1000 1
**********
FIRST CALL TO USER FUNCTION AT NEW START POINT, WITH IFLAG=4.
START MIGRAD MINIMIZATION. STRATEGY 1. CONVERGENCE WHEN EDM .LT. 1.00e-03
FCN=244.778 FROM MIGRAD STATUS=INITIATE 6 CALLS 7 TOTAL
EDM= unknown STRATEGY= 1 NO ERROR MATRIX
EXT PARAMETER CURRENT GUESS STEP FIRST
NO. NAME VALUE ERROR SIZE DERIVATIVE
1 mean -3.00000e+00 2.00000e+00 2.11716e-01 7.88402e+00
2 sigma 3.00000e+00 9.90000e-01 2.22742e-01 8.68850e+00
ERR DEF= 0.5
MIGRAD MINIMIZATION HAS CONVERGED.
MIGRAD WILL VERIFY CONVERGENCE AND ERROR MATRIX.
COVARIANCE MATRIX CALCULATED SUCCESSFULLY
FCN=244.648 FROM MIGRAD STATUS=CONVERGED 27 CALLS 28 TOTAL
EDM=6.12289e-07 STRATEGY= 1 ERROR MATRIX ACCURATE
EXT PARAMETER STEP FIRST
NO. NAME VALUE ERROR SIZE DERIVATIVE
1 mean -3.06106e+00 3.00167e-01 3.38614e-04 -1.01280e-02
2 sigma 2.89572e+00 2.28664e-01 5.51106e-04 1.31676e-02
ERR DEF= 0.5
EXTERNAL ERROR MATRIX. NDIM= 25 NPAR= 2 ERR DEF=0.5
9.013e-02 -8.498e-03
-8.498e-03 5.233e-02
PARAMETER CORRELATION COEFFICIENTS
NO. GLOBAL 1 2
1 0.12374 1.000 -0.124
2 0.12374 -0.124 1.000
**********
** 7 **SET ERR 0.5
**********
**********
** 8 **SET PRINT 1
**********
**********
** 9 **HESSE 1000
**********
COVARIANCE MATRIX CALCULATED SUCCESSFULLY
FCN=244.648 FROM HESSE STATUS=OK 10 CALLS 38 TOTAL
EDM=6.13161e-07 STRATEGY= 1 ERROR MATRIX ACCURATE
EXT PARAMETER INTERNAL INTERNAL
NO. NAME VALUE ERROR STEP SIZE VALUE
1 mean -3.06106e+00 3.00196e-01 6.77227e-05 -3.11100e-01
2 sigma 2.89572e+00 2.28685e-01 1.10221e-04 -4.50268e-01
ERR DEF= 0.5
EXTERNAL ERROR MATRIX. NDIM= 25 NPAR= 2 ERR DEF=0.5
9.015e-02 -8.552e-03
-8.552e-03 5.234e-02
PARAMETER CORRELATION COEFFICIENTS
NO. GLOBAL 1 2
1 0.12449 1.000 -0.124
2 0.12449 -0.124 1.000
[#1] INFO:Minization -- RooMinimizer::optimizeConst: deactivating const optimization
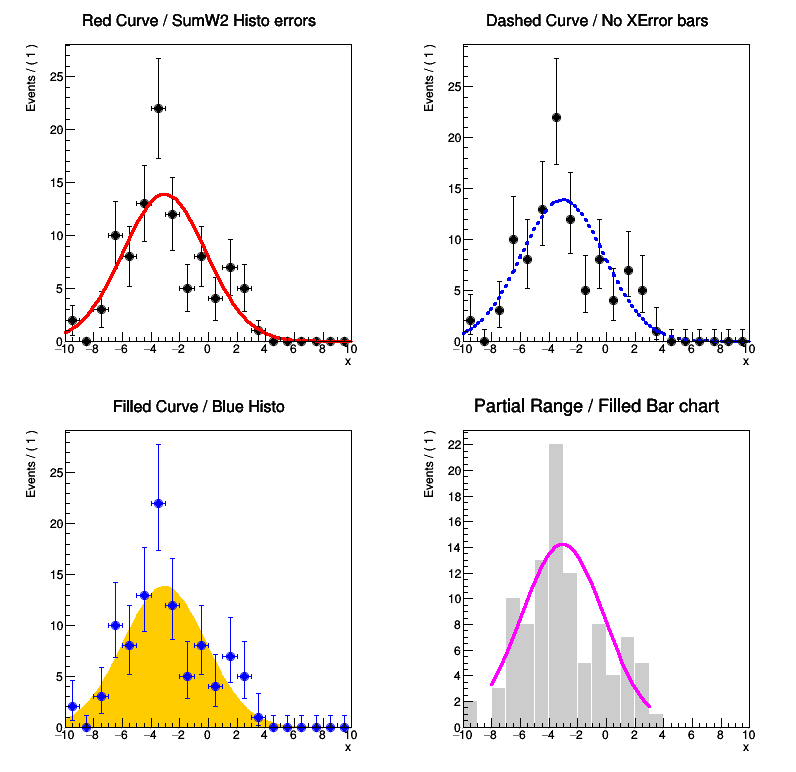
[#1] INFO:Plotting -- RooAbsPdf::plotOn(gauss) only plotting range [-8,3], curve is normalized to data in given given range
[#1] INFO:Eval -- RooRealVar::setRange(x) new range named 'plotRange' created with bounds [-8,3]


 ROOT 6.07/09 - Reference Guide Generated on Wed Oct 19 2016 02:19:07 using Doxygen 1.8.12.

