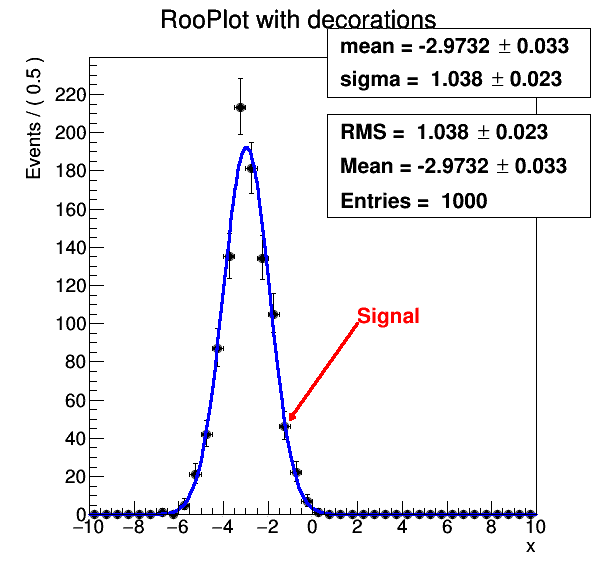
Adding boxes with parameters, statistics to RooPlots. Decorating RooPlots with arrows, text etc...
Processing /mnt/vdb/lsf/workspace/root-makedoc-v608/rootspi/rdoc/src/v6-08-00-patches/tutorials/roofit/rf106_plotdecoration.C...
�[1mRooFit v3.60 -- Developed by Wouter Verkerke and David Kirkby�[0m
Copyright (C) 2000-2013 NIKHEF, University of California & Stanford University
All rights reserved, please read http://roofit.sourceforge.net/license.txt
[#1] INFO:Minization -- RooMinimizer::optimizeConst: activating const optimization
**********
** 1 **SET PRINT 1
**********
**********
** 2 **SET NOGRAD
**********
PARAMETER DEFINITIONS:
NO. NAME VALUE STEP SIZE LIMITS
1 mean -3.00000e+00 2.00000e+00 -1.00000e+01 1.00000e+01
2 sigma 1.00000e+00 4.50000e-01 1.00000e-01 1.00000e+01
**********
** 3 **SET ERR 0.5
**********
**********
** 4 **SET PRINT 1
**********
**********
** 5 **SET STR 1
**********
NOW USING STRATEGY 1: TRY TO BALANCE SPEED AGAINST RELIABILITY
**********
** 6 **MIGRAD 1000 1
**********
FIRST CALL TO USER FUNCTION AT NEW START POINT, WITH IFLAG=4.
START MIGRAD MINIMIZATION. STRATEGY 1. CONVERGENCE WHEN EDM .LT. 1.00e-03
FCN=1457.87 FROM MIGRAD STATUS=INITIATE 8 CALLS 9 TOTAL
EDM= unknown STRATEGY= 1 NO ERROR MATRIX
EXT PARAMETER CURRENT GUESS STEP FIRST
NO. NAME VALUE ERROR SIZE DERIVATIVE
1 mean -3.00000e+00 2.00000e+00 2.11716e-01 -2.55667e+02
2 sigma 1.00000e+00 4.50000e-01 1.63378e-01 -2.21584e+02
ERR DEF= 0.5
MIGRAD MINIMIZATION HAS CONVERGED.
MIGRAD WILL VERIFY CONVERGENCE AND ERROR MATRIX.
COVARIANCE MATRIX CALCULATED SUCCESSFULLY
FCN=1456.09 FROM MIGRAD STATUS=CONVERGED 31 CALLS 32 TOTAL
EDM=1.47238e-07 STRATEGY= 1 ERROR MATRIX ACCURATE
EXT PARAMETER STEP FIRST
NO. NAME VALUE ERROR SIZE DERIVATIVE
1 mean -2.97319e+00 3.28196e-02 9.04112e-05 1.05544e-01
2 sigma 1.03785e+00 2.32067e-02 2.10225e-04 -1.56386e-02
ERR DEF= 0.5
EXTERNAL ERROR MATRIX. NDIM= 25 NPAR= 2 ERR DEF=0.5
1.077e-03 4.600e-07
4.600e-07 5.386e-04
PARAMETER CORRELATION COEFFICIENTS
NO. GLOBAL 1 2
1 0.00060 1.000 0.001
2 0.00060 0.001 1.000
**********
** 7 **SET ERR 0.5
**********
**********
** 8 **SET PRINT 1
**********
**********
** 9 **HESSE 1000
**********
COVARIANCE MATRIX CALCULATED SUCCESSFULLY
FCN=1456.09 FROM HESSE STATUS=OK 10 CALLS 42 TOTAL
EDM=1.47267e-07 STRATEGY= 1 ERROR MATRIX ACCURATE
EXT PARAMETER INTERNAL INTERNAL
NO. NAME VALUE ERROR STEP SIZE VALUE
1 mean -2.97319e+00 3.28196e-02 1.80822e-05 -3.01883e-01
2 sigma 1.03785e+00 2.32067e-02 8.40899e-06 -9.45066e-01
ERR DEF= 0.5
EXTERNAL ERROR MATRIX. NDIM= 25 NPAR= 2 ERR DEF=0.5
1.077e-03 1.019e-07
1.019e-07 5.386e-04
PARAMETER CORRELATION COEFFICIENTS
NO. GLOBAL 1 2
1 0.00013 1.000 0.000
2 0.00013 0.000 1.000
[#1] INFO:Minization -- RooMinimizer::optimizeConst: deactivating const optimization


 ROOT 6.07/09 - Reference Guide Generated on Wed Oct 19 2016 02:19:07 using Doxygen 1.8.12.

