With default parameters the macro will attempt to run the standard hist2workspace example and read the ROOT file that it produces.
The first ~100 lines define a new test statistic, then the main macro starts. You may want to control:
This uses a modified version of the profile likelihood ratio as a test statistic for upper limits (eg. test stat = 0 if muhat>mu).
Based on the observed data, one defines a set of parameter points to be tested based on the value of the parameter of interest and the conditional MLE (eg. profiled) values of the nuisance parameters.
At each parameter point, pseudo-experiments are generated using this fixed reference model and then the test statistic is evaluated. Note, the nuisance parameters are floating in the fits. For each point, the threshold that defines the 95% acceptance region is found. This forms a "Confidence Belt".
After constructing the confidence belt, one can find the confidence interval for any particular dataset by finding the intersection of the observed test statistic and the confidence belt. First this is done on the observed data to get an observed 1-sided upper limt.
Finally, there expected limit and bands (from background-only) are formed by generating background-only data and finding the upper limit. This is done by hand for now, will later be part of the RooStats tools.
On a technical note, this technique is NOT the Feldman-Cousins technique, because that is a 2-sided interval BY DEFINITION. However, like the Feldman-Cousins technique this is a Neyman-Construction. For technical reasons the easiest way to implement this right now is to use the FeldmanCousins tool and then change the test statistic that it is using.
Building the confidence belt can be computationally expensive. Once it is built, one could save it to a file and use it in a separate step.
We can use PROOF to speed things along in parallel, however, the test statistic has to be installed on the workers so either turn off PROOF or include the modified test statistic in your $ROOTSYS/roofit/roostats/inc directory, add the additional line to the LinkDef.h file, and recompile root.
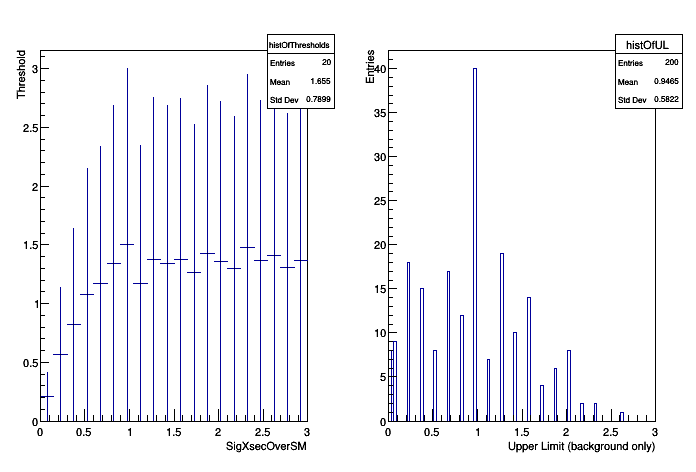
Note, if you have a boundary on the parameter of interest (eg. cross-section) the threshold on the one-sided test statistic starts off very small because we are only including downward fluctuations. You can see the threshold in these printouts:
this tells you the values of the parameters being used to generate the pseudo-experiments and the threshold in this case is 0.011215. One would expect for 95% that the threshold would be ~1.35 once the cross-section is far enough away from 0 that it is essentially unaffected by the boundary. As one reaches the last points in the scan, the theshold starts to get artificially high. This is because the range of the parameter in the fit is the same as the range in the scan. In the future, these should be independently controlled, but they are not now. As a result the ~50% of pseudo-experiments that have an upward fluctuation end up with muhat = muMax. Because of this, the upper range of the parameter should be well above the expected upper limit... but not too high or one will need a very large value of nPointsToScan to resolve the relevant region. This can be improved, but this is the first version of this script.
Important note: when the model includes external constraint terms, like a Gaussian constraint to a nuisance parameter centered around some nominal value there is a subtlety. The asymptotic results are all based on the assumption that all the measurements fluctuate... including the nominal values from auxiliary measurements. If these do not fluctuate, this corresponds to an "conditional ensemble". The result is that the distribution of the test statistic can become very non-chi^2. This results in thresholds that become very large. This can be seen in the following thought experiment. Say the model is \( Pois(N | s + b)G(b0|b,sigma) \) where \( G(b0|b,sigma) \) is the external constraint and b0 is 100. If N is also 100 then the profiled value of b given s is going to be some trade off between 100-s and b0. If sigma is \( \sqrt(N) \), then the profiled value of b is probably 100 - s/2 So for s=60 we are going to have a profiled value of b~70. Now when we generate pseudo-experiments for s=60, b=70 we will have N~130 and the average shat will be 30, not 60. In practice, this is only an issue for values of s that are very excluded. For values of s near the 95% limit this should not be a big effect. This can be avoided if the nominal values of the constraints also fluctuate, but that requires that those parameters are RooRealVars in the model. This version does not deal with this issue, but it will be addressed in a future version.
Processing /mnt/vdb/lsf/workspace/root-makedoc-v608/rootspi/rdoc/src/v6-08-00-patches/tutorials/roostats/OneSidedFrequentistUpperLimitWithBands.C...
�[1mRooFit v3.60 -- Developed by Wouter Verkerke and David Kirkby�[0m
Copyright (C) 2000-2013 NIKHEF, University of California & Stanford University
All rights reserved, please read http://roofit.sourceforge.net/license.txt
FeldmanCousins: ntoys per point = 999
FeldmanCousins: nEvents per toy will fluctuate about expectation
will use global observables for unconditional ensemble
RooArgSet:: = (nom_alpha_syst2,nom_alpha_syst3,nom_gamma_stat_channel1_bin_0,nom_gamma_stat_channel1_bin_1)
=== Using the following for ModelConfig ===
Observables: RooArgSet:: = (obs_x_channel1,weightVar,channelCat)
Parameters of Interest: RooArgSet:: = (SigXsecOverSM)
Nuisance Parameters: RooArgSet:: = (alpha_syst2,alpha_syst3,gamma_stat_channel1_bin_0,gamma_stat_channel1_bin_1)
Global Observables: RooArgSet:: = (nom_alpha_syst2,nom_alpha_syst3,nom_gamma_stat_channel1_bin_0,nom_gamma_stat_channel1_bin_1)
PDF: RooSimultaneous::simPdf[ indexCat=channelCat channel1=model_channel1 ] = 0.174888
FeldmanCousins: Model has nuisance parameters, will do profile construction
FeldmanCousins: # points to test = 20
[#0] PROGRESS:Generation -- generated toys: 500 / 999
lookup index = 0
NeymanConstruction: Prog: 1/20 total MC = 999 this test stat = 0
SigXsecOverSM=0.075 alpha_syst2=0.656048 alpha_syst3=0.244567 gamma_stat_channel1_bin_0=1.03397 gamma_stat_channel1_bin_1=1.04971 [-1e+30, 0.20761] in interval = 1
[#0] PROGRESS:Generation -- generated toys: 500 / 999
NeymanConstruction: Prog: 2/20 total MC = 999 this test stat = 0
SigXsecOverSM=0.225 alpha_syst2=0.549579 alpha_syst3=0.211046 gamma_stat_channel1_bin_0=1.02849 gamma_stat_channel1_bin_1=1.04283 [-1e+30, 0.570178] in interval = 1
[#0] PROGRESS:Generation -- generated toys: 500 / 999
NeymanConstruction: Prog: 3/20 total MC = 999 this test stat = 0
SigXsecOverSM=0.375 alpha_syst2=0.44775 alpha_syst3=0.177828 gamma_stat_channel1_bin_0=1.02318 gamma_stat_channel1_bin_1=1.03602 [-1e+30, 0.820922] in interval = 1
[#0] PROGRESS:Generation -- generated toys: 500 / 999
NeymanConstruction: Prog: 4/20 total MC = 999 this test stat = 0
SigXsecOverSM=0.525 alpha_syst2=0.349863 alpha_syst3=0.144895 gamma_stat_channel1_bin_0=1.01804 gamma_stat_channel1_bin_1=1.02929 [-1e+30, 1.07394] in interval = 1
[#0] PROGRESS:Generation -- generated toys: 500 / 999
NeymanConstruction: Prog: 5/20 total MC = 999 this test stat = 0
SigXsecOverSM=0.675 alpha_syst2=0.255203 alpha_syst3=0.11224 gamma_stat_channel1_bin_0=1.01307 gamma_stat_channel1_bin_1=1.02264 [-1e+30, 1.16908] in interval = 1
[#0] PROGRESS:Generation -- generated toys: 500 / 999
NeymanConstruction: Prog: 6/20 total MC = 999 this test stat = 0
SigXsecOverSM=0.825 alpha_syst2=0.16608 alpha_syst3=0.0821439 gamma_stat_channel1_bin_0=1.00838 gamma_stat_channel1_bin_1=1.01547 [-1e+30, 1.34163] in interval = 1
[#0] PROGRESS:Generation -- generated toys: 500 / 999
NeymanConstruction: Prog: 7/20 total MC = 999 this test stat = 0
SigXsecOverSM=0.975 alpha_syst2=0.0745784 alpha_syst3=0.0487673 gamma_stat_channel1_bin_0=1.00375 gamma_stat_channel1_bin_1=1.00931 [-1e+30, 1.50039] in interval = 1
[#0] PROGRESS:Generation -- generated toys: 500 / 999
NeymanConstruction: Prog: 8/20 total MC = 999 this test stat = 0.000125096
SigXsecOverSM=1.125 alpha_syst2=-0.0140996 alpha_syst3=0.0151511 gamma_stat_channel1_bin_0=0.999297 gamma_stat_channel1_bin_1=1.00317 [-1e+30, 1.17337] in interval = 1
[#0] PROGRESS:Generation -- generated toys: 500 / 999
NeymanConstruction: Prog: 9/20 total MC = 999 this test stat = 0.0347209
SigXsecOverSM=1.275 alpha_syst2=-0.101327 alpha_syst3=-0.0176472 gamma_stat_channel1_bin_0=0.994967 gamma_stat_channel1_bin_1=0.99714 [-1e+30, 1.37936] in interval = 1
[#0] PROGRESS:Generation -- generated toys: 500 / 999
NeymanConstruction: Prog: 10/20 total MC = 999 this test stat = 0.12986
SigXsecOverSM=1.425 alpha_syst2=-0.185801 alpha_syst3=-0.0506339 gamma_stat_channel1_bin_0=0.990814 gamma_stat_channel1_bin_1=0.991141 [-1e+30, 1.34227] in interval = 1
[#0] PROGRESS:Generation -- generated toys: 500 / 999
NeymanConstruction: Prog: 11/20 total MC = 999 this test stat = 0.284381
SigXsecOverSM=1.575 alpha_syst2=-0.266353 alpha_syst3=-0.0784096 gamma_stat_channel1_bin_0=0.987025 gamma_stat_channel1_bin_1=0.984445 [-1e+30, 1.37278] in interval = 1
[#0] PROGRESS:Generation -- generated toys: 500 / 999
NeymanConstruction: Prog: 12/20 total MC = 999 this test stat = 0.497424
SigXsecOverSM=1.725 alpha_syst2=-0.3458 alpha_syst3=-0.10947 gamma_stat_channel1_bin_0=0.983247 gamma_stat_channel1_bin_1=0.978371 [-1e+30, 1.26158] in interval = 1
[#0] PROGRESS:Generation -- generated toys: 500 / 999
NeymanConstruction: Prog: 13/20 total MC = 999 this test stat = 0.767852
SigXsecOverSM=1.875 alpha_syst2=-0.422672 alpha_syst3=-0.140541 gamma_stat_channel1_bin_0=0.979595 gamma_stat_channel1_bin_1=0.972417 [-1e+30, 1.43021] in interval = 1
[#0] PROGRESS:Generation -- generated toys: 500 / 999
NeymanConstruction: Prog: 14/20 total MC = 999 this test stat = 1.09468
SigXsecOverSM=2.025 alpha_syst2=-0.496602 alpha_syst3=-0.171004 gamma_stat_channel1_bin_0=0.976094 gamma_stat_channel1_bin_1=0.966484 [-1e+30, 1.36213] in interval = 1
[#0] PROGRESS:Generation -- generated toys: 500 / 999
NeymanConstruction: Prog: 15/20 total MC = 999 this test stat = 1.47704
SigXsecOverSM=2.175 alpha_syst2=-0.567566 alpha_syst3=-0.201186 gamma_stat_channel1_bin_0=0.972718 gamma_stat_channel1_bin_1=0.960626 [-1e+30, 1.29648] in interval = 0
[#0] PROGRESS:Generation -- generated toys: 500 / 999
NeymanConstruction: Prog: 16/20 total MC = 999 this test stat = 1.91389
SigXsecOverSM=2.325 alpha_syst2=-0.63553 alpha_syst3=-0.231072 gamma_stat_channel1_bin_0=0.96946 gamma_stat_channel1_bin_1=0.954845 [-1e+30, 1.47564] in interval = 0
[#0] PROGRESS:Generation -- generated toys: 500 / 999
NeymanConstruction: Prog: 17/20 total MC = 999 this test stat = 2.40432
SigXsecOverSM=2.475 alpha_syst2=-0.700748 alpha_syst3=-0.261131 gamma_stat_channel1_bin_0=0.966278 gamma_stat_channel1_bin_1=0.949239 [-1e+30, 1.36517] in interval = 0
[#0] PROGRESS:Generation -- generated toys: 500 / 999
NeymanConstruction: Prog: 18/20 total MC = 999 this test stat = 2.94737
SigXsecOverSM=2.625 alpha_syst2=-0.763083 alpha_syst3=-0.290538 gamma_stat_channel1_bin_0=0.963225 gamma_stat_channel1_bin_1=0.943654 [-1e+30, 1.40945] in interval = 0
[#0] PROGRESS:Generation -- generated toys: 500 / 999
NeymanConstruction: Prog: 19/20 total MC = 999 this test stat = 3.54209
SigXsecOverSM=2.775 alpha_syst2=-0.822865 alpha_syst3=-0.319576 gamma_stat_channel1_bin_0=0.960275 gamma_stat_channel1_bin_1=0.938148 [-1e+30, 1.3071] in interval = 0
[#0] PROGRESS:Generation -- generated toys: 500 / 999
NeymanConstruction: Prog: 20/20 total MC = 999 this test stat = 4.18752
SigXsecOverSM=2.925 alpha_syst2=-0.880381 alpha_syst3=-0.348221 gamma_stat_channel1_bin_0=0.957426 gamma_stat_channel1_bin_1=0.932721 [-1e+30, 1.37059] in interval = 0
[#1] INFO:Eval -- 14 points in interval
95% interval on SigXsecOverSM is : [0.075, 2.025]
[#1] INFO:Minization -- p.d.f. provides expected number of events, including extended term in likelihood.
[#1] INFO:Minization -- Including the following contraint terms in minimization: (lumiConstraint,alpha_syst1Constraint,alpha_syst2Constraint,alpha_syst3Constraint,gamma_stat_channel1_bin_0_constraint,gamma_stat_channel1_bin_1_constraint)
[#1] INFO:Minization -- RooProfileLL::evaluate(nll_simPdf_obsData_with_constr_Profile[SigXsecOverSM]) Creating instance of MINUIT
[#1] INFO:Fitting -- RooAddition::defaultErrorLevel(nll_simPdf_obsData_with_constr) Summation contains a RooNLLVar, using its error level
[#1] INFO:Minization -- RooProfileLL::evaluate(nll_simPdf_obsData_with_constr_Profile[SigXsecOverSM]) determining minimum likelihood for current configurations w.r.t all observable
RooAbsTestStatistic::initSimMode: creating slave calculator #0 for state channel1 (2 dataset entries)
[#1] INFO:Fitting -- RooAbsTestStatistic::initSimMode: created 1 slave calculators.
[#1] INFO:Minization -- RooProfileLL::evaluate(nll_simPdf_obsData_with_constr_Profile[SigXsecOverSM]) minimum found at (SigXsecOverSM=1.11575)
.
Will use these parameter points to generate pseudo data for bkg only
1) 0x31ff350 RooRealVar:: alpha_syst2 = 0.71117 +/- 0.914105 L(-5 - 5) "alpha_syst2"
2) 0x31f4920 RooRealVar:: alpha_syst3 = 0.261459 +/- 0.929099 L(-5 - 5) "alpha_syst3"
3) 0x30eae20 RooRealVar:: gamma_stat_channel1_bin_0 = 1.03677 +/- 0.0462899 L(0 - 1.25) "gamma_stat_channel1_bin_0"
4) 0x30db580 RooRealVar:: gamma_stat_channel1_bin_1 = 1.05319 +/- 0.0761204 L(0 - 1.5) "gamma_stat_channel1_bin_1"
5) 0x30ca070 RooRealVar:: SigXsecOverSM = 0 +/- 0 L(0 - 3) B(20) "SigXsecOverSM"
-2 sigma band 2.36339e-310
-1 sigma band 0.195 [Power Constraint)]
median of band 0.945
+1 sigma band 1.545
+2 sigma band 2.145
observed 95% upper-limit 2.025
CLb strict [P(toy>obs|0)] for observed 95% upper-limit 0.965
CLb inclusive [P(toy>=obs|0)] for observed 95% upper-limit 0.965
bool useProof = false;
int nworkers = 0;
void OneSidedFrequentistUpperLimitWithBands(const char* infile = "",
const char* workspaceName = "combined",
const char* modelConfigName = "ModelConfig",
const char* dataName = "obsData") {
double confidenceLevel=0.95;
int nPointsToScan = 20;
int nToyMC = 200;
const char* filename = "";
if (!strcmp(infile,"")) {
filename = "results/example_combined_GaussExample_model.root";
if (!fileExist) {
#ifdef _WIN32
cout << "HistFactory file cannot be generated on Windows - exit" << endl;
return;
#endif
cout <<"will run standard hist2workspace example"<<endl;
gROOT->ProcessLine(
".! prepareHistFactory .");
gROOT->ProcessLine(
".! hist2workspace config/example.xml");
cout <<"\n\n---------------------"<<endl;
cout <<"Done creating example input"<<endl;
cout <<"---------------------\n\n"<<endl;
}
}
else
filename = infile;
if(!file ){
cout <<"StandardRooStatsDemoMacro: Input file " << filename << " is not found" << endl;
return;
}
if(!w){
cout <<"workspace not found" << endl;
return;
}
if(!data || !mc){
cout << "data or ModelConfig was not found" <<endl;
return;
}
fc.SetConfidenceLevel(confidenceLevel);
fc.SetNBins(nPointsToScan);
fc.CreateConfBelt(true);
fc.FluctuateNumDataEntries(false);
else
cout <<"Not sure what to do about this model" <<endl;
}
if (useProof) {
}
cout << "will use global observables for unconditional ensemble"<<endl;
}
cout <<
"\n95% interval on " <<firstPOI->
GetName()<<
" is : ["<<
double observedUL = interval->
UpperLimit(*firstPOI);
double obsTSatObsUL = fc.GetTestStatSampler()->EvaluateTestStatistic(*data,tmpPOI);
TH1F* histOfThresholds =
new TH1F(
"histOfThresholds",
"",
histOfThresholds->
Fill(poiVal,arMax);
}
histOfThresholds->
Draw();
cout << "\nWill use these parameter points to generate pseudo data for bkg only" << endl;
paramsToGenerateData->
Print(
"v");
double CLb=0;
double CLbinclusive=0;
for(int imc=0; imc<nToyMC; ++imc){
else
cout <<"Not sure what to do about this model" <<endl;
} else{
}
if(!simPdf){
*allVars = *values;
delete allVars;
delete values;
delete one;
} else {
*globtmp = *tmp->
get(0) ;
delete globtmp ;
delete tmp ;
}
}
double toyTSatObsUL = fc.GetTestStatSampler()->EvaluateTestStatistic(*toyData,tmpPOI);
if(obsTSatObsUL < toyTSatObsUL)
CLb+= (1.)/nToyMC;
if(obsTSatObsUL <= toyTSatObsUL)
CLbinclusive+= (1.)/nToyMC;
double thisUL = 0;
double thisTS = fc.GetTestStatSampler()->EvaluateTestStatistic(*toyData,tmpPOI);
if(thisTS<=arMax){
} else{
break;
}
}
delete toyData;
}
c1->
SaveAs(
"one-sided_upper_limit_output.pdf");
double band2sigDown, band1sigDown, bandMedian, band1sigUp,band2sigUp;
for(
int i=1; i<=cumulative->
GetNbinsX(); ++i){
if(bins[i]<0.5)
}
cout << "-2 sigma band " << band2sigDown << endl;
cout << "-1 sigma band " << band1sigDown << " [Power Constraint)]" << endl;
cout << "median of band " << bandMedian << endl;
cout << "+1 sigma band " << band1sigUp << endl;
cout << "+2 sigma band " << band2sigUp << endl;
cout <<
"\nobserved 95% upper-limit "<< interval->
UpperLimit(*firstPOI) <<endl;
cout << "CLb strict [P(toy>obs|0)] for observed 95% upper-limit "<< CLb <<endl;
cout << "CLb inclusive [P(toy>=obs|0)] for observed 95% upper-limit "<< CLbinclusive <<endl;
delete profile;
delete nll;
}


 ROOT 6.07/09 - Reference Guide Generated on Wed Oct 19 2016 02:20:21 using Doxygen 1.8.12.

