Logo ROOT   6.07/09
Reference Guide
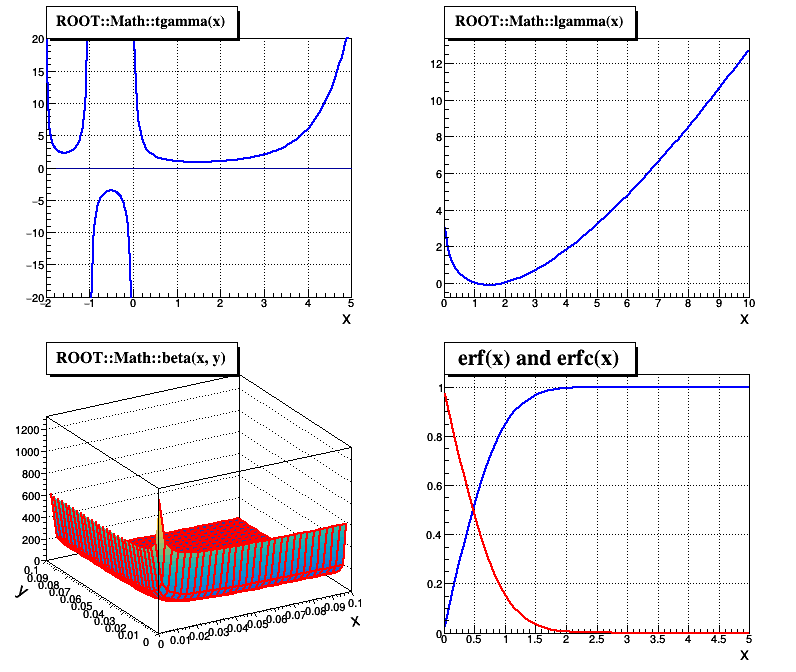
GammaFun.C File Reference

Detailed Description

View in nbviewer Open in SWAN Example showing the usage of the major special math functions (gamma, beta, erf) in ROOT To execute the macro type in:

root[0]: .x GammaFun.C

It will create one canvas with the representation of the tgamma, lgamma, beta, erf and erfc functions

pict1_GammaFun.C.png
#include "TMath.h"
#include "TF1.h"
#include "TF2.h"
#include "TSystem.h"
#include "TCanvas.h"
#include "TStyle.h"
#include "TPaveLabel.h"
#include "TAxis.h"
#include "TH1.h"
void GammaFun() {
gSystem->Load("libMathCore");
TF1 *f1a = new TF1("Gamma(x)","ROOT::Math::tgamma(x)",-2,5);
TF1 *f2a = new TF1("f2a","ROOT::Math::lgamma(x)",0,10);
TF2 *f3a = new TF2("Beta(x)","ROOT::Math::beta(x, y)",0,0.1, 0, 0.1);
TF1 *f4a = new TF1("erf(x)","ROOT::Math::erf(x)",0,5);
TF1 *f4b = new TF1("erfc(x)","ROOT::Math::erfc(x)",0,5);
TCanvas *c1 = new TCanvas("c1", "Gamma and related functions",800,700);
c1->Divide(2,2);
c1->cd(1);
gPad->SetGrid();
//setting the title in a label style
TPaveLabel *p1 = new TPaveLabel(.1,.90 , (.1+.50),(.90+.10) ,"ROOT::Math::tgamma(x)", "NDC");
p1->SetFillColor(0);
p1->SetTextFont(22);
//setting graph
// draw axis first (use TH1 to draw the frame)
TH1F * h = new TH1F("htmp","",500,-2,5);
h->SetMinimum(-20);
h->SetMaximum(20);
h->GetXaxis()->SetTitleSize(0.06);
h->GetXaxis()->SetTitle("x");
h->Draw();
// draw the functions 3 times in the separate ranges to avoid singularities
f1a->SetLineWidth(2);
f1a->SetLineColor(kBlue);
f1a->SetRange(-2,-1);
f1a->DrawCopy("same");
f1a->SetRange(-1,0);
f1a->DrawCopy("same");
f1a->SetRange(0,5);
f1a->DrawCopy("same");
p1->Draw();
c1->cd(2);
gPad->SetGrid();
TPaveLabel *p2 = new TPaveLabel(.1,.90 , (.1+.50),(.90+.10) ,"ROOT::Math::lgamma(x)", "NDC");
p2->SetFillColor(0);
p2->SetTextFont(22);
f2a->SetLineColor(kBlue);
f2a->SetLineWidth(2);
f2a->GetXaxis()->SetTitle("x");
f2a->GetXaxis()->SetTitleSize(0.06);
f2a->GetXaxis()->SetTitleOffset(.7);
f2a->SetTitle("");
f2a->Draw();
p2->Draw();
c1->cd(3);
gPad->SetGrid();
TPaveLabel *p3 = new TPaveLabel(.1,.90 , (.1+.50),(.90+.10) ,"ROOT::Math::beta(x, y)", "NDC");
p3->SetFillColor(0);
p3->SetTextFont(22);
f3a->SetLineWidth(2);
f3a->GetXaxis()->SetTitle("x");
f3a->GetXaxis()->SetTitleOffset(1.2);
f3a->GetXaxis()->SetTitleSize(0.06);
f3a->GetYaxis()->SetTitle("y");
f3a->GetYaxis()->SetTitleSize(0.06);
f3a->GetYaxis()->SetTitleOffset(1.5);
f3a->SetTitle("");
f3a->Draw("surf1");//option for a 3-dim plot
p3->Draw();
c1->cd(4);
gPad->SetGrid();
TPaveLabel *p4 = new TPaveLabel(.1,.90 , (.1+.50),(.90+.10) ,"erf(x) and erfc(x)", "NDC");
p4->SetFillColor(0);
p4->SetTextFont(22);
f4a->SetTitle("erf(x) and erfc(x)");
f4a->SetLineWidth(2);
f4b->SetLineWidth(2);
f4a->SetLineColor(kBlue);
f4b->SetLineColor(kRed);
f4a->GetXaxis()->SetTitleSize(.06);
f4a->GetXaxis()->SetTitleOffset(.7);
f4a->GetXaxis()->SetTitle("x");
f4a->Draw();
f4b->Draw("same");//option for a multiple graph plot
f4a->SetTitle("");
p4->Draw();
}
Author
Magdalena Slawinska

Definition in file GammaFun.C.