
 Example of function called when a mouse event occurs in a pad.
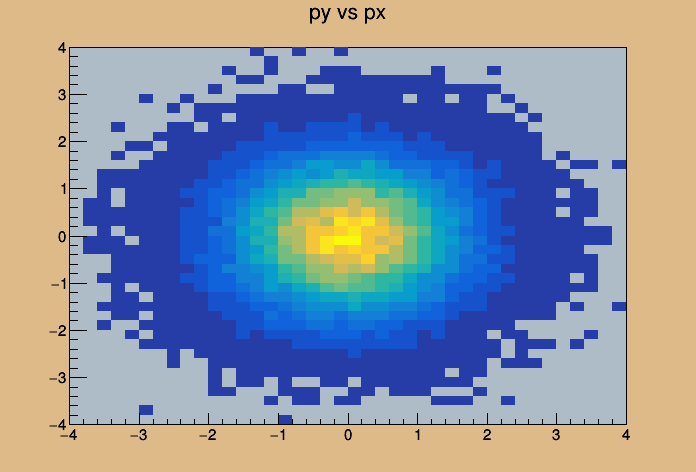
When moving the mouse in the canvas, a second canvas shows the projection along X of the bin corresponding to the Y position of the mouse. The resulting histogram is fitted with a gaussian. A "dynamic" line shows the current bin position in Y. This more elaborated example can be used as a starting point to develop more powerful interactive applications exploiting CINT as a development engine.
Note that a class is used to hold on to the canvas that display the selected slice.
4 from ROOT
import gRandom, gPad, gROOT, gVirtualX
5 from ROOT
import kTRUE, kRed
6 from ROOT
import TCanvas, TH2, TH2F, Double
18 h = gPad.GetSelected();
22 if not isinstance( h, TH2 ):
25 gPad.GetCanvas().FeedbackMode( kTRUE )
31 uxmin, uxmax = gPad.GetUxmin(), gPad.GetUxmax()
32 uymin, uymax = gPad.GetUymin(), gPad.GetUymax()
33 pxmin, pxmax = gPad.XtoAbsPixel( uxmin ), gPad.XtoAbsPixel( uxmax )
34 pymin, pymax = gPad.YtoAbsPixel( uymin ), gPad.YtoAbsPixel( uymax )
37 gVirtualX.DrawLine( pxmin, self._old[1], pxmax, self._old[1] )
38 gVirtualX.DrawLine( self._old[0], pymin, self._old[0], pymax )
39 gVirtualX.DrawLine( pxmin, py, pxmax, py )
40 gVirtualX.DrawLine( px, pymin, px, pymax )
44 upx = gPad.AbsPixeltoX( px )
45 x = gPad.PadtoX( upx )
46 upy = gPad.AbsPixeltoY( py )
47 y = gPad.PadtoY( upy )
53 self._cX =
TCanvas(
'c2',
'Projection Canvas in X', 730, 10, 700, 500 )
55 self._DestroyPrimitive(
'X' )
58 self._cY =
TCanvas(
'c3',
'Projection Canvas in Y', 10, 550, 700, 500 )
60 self._DestroyPrimitive(
'Y' )
62 self.DrawSlice( h, y,
'Y' )
63 self.DrawSlice( h, x,
'X' )
67 def _DestroyPrimitive( self, xy ):
68 proj = getattr( self,
'_c'+xy ).GetPrimitive(
'Projection '+xy )
70 proj.IsA().Destructor( proj )
72 def DrawSlice( self, histo, value, xy ):
73 yx = xy ==
'X' and 'Y' or 'X' 76 canvas = getattr( self,
'_c'+xy )
80 bin = getattr( histo,
'Get%saxis' % xy )().FindBin( value )
81 hp = getattr( histo,
'Projection' + yx )(
'', bin, bin )
83 hp.SetName(
'Projection ' + xy )
84 hp.SetTitle( xy +
'Projection of bin=%d' % bin )
85 hp.Fit(
'gaus',
'ql' )
91 if __name__ ==
'__main__':
93 c1 =
TCanvas(
'c1',
'Dynamic Slice Example', 10, 10, 700, 500 )
95 c1.SetFrameFillColor( 33 )
98 hpxpy =
TH2F(
'hpxpy',
'py vs px', 40, -4, 4, 40, -4, 4 )
101 for i
in range( 50000 ):
102 gRandom.Rannor( x, y )
108 __main__.slicer = DynamicExec()
109 c1.AddExec(
'dynamic',
'TPython::Exec( "slicer()" );' )
- Author
- Rene Brun, Johann Cohen-Tanugi, Wim Lavrijsen
Definition in file DynamicSlice.py.

 ROOT 6.07/09 - Reference Guide Generated on Wed Oct 19 2016 02:18:52 using Doxygen 1.8.12.

