| gtime.C: Example of a graph of data moving in time | Basic Graphics | latex2.C: This macro draws 4 Latex-style formula in a canvas and prints the canvas |
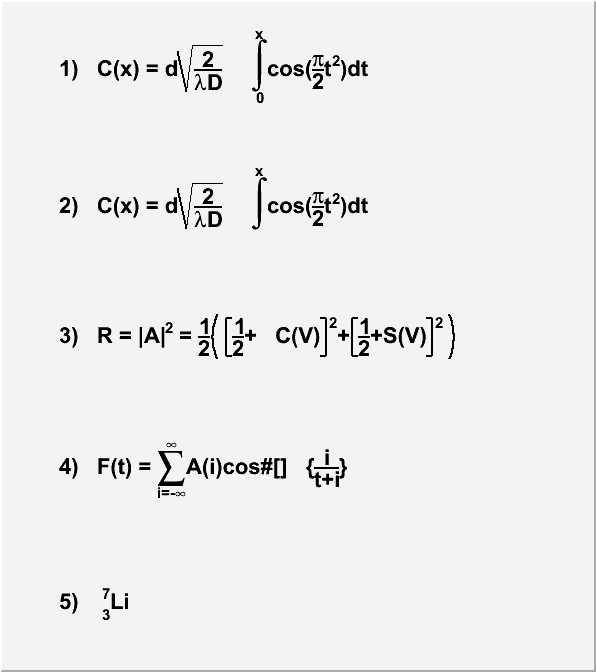
latex.C: This macro draws 4 Latex-style formula in a canvas and prints the canvas
// This macro draws 4 Latex-style formula in a canvas and prints the canvas // as a Postscript file. // Note that this macro relies on a first implementation of the TLatex class. // There are still some discrepancies between the result on the screen // and the result on Postscript. // Also some differences will be seen between Unix servers depending // the version of X in use. Results on WindowsNT are also slightly different. //Author: Rene Brun void latex() { TCanvas *c1 = new TCanvas("c1","test",600,700); // write formulas TLatex l; l.SetTextAlign(12); l.SetTextSize(0.04); l.DrawLatex(0.1,0.9,"1) C(x) = d #sqrt{#frac{2}{#lambdaD}} \ #int^{x}_{0}cos(#frac{#pi}{2}t^{2})dt"); l.DrawLatex(0.1,0.7,"2) C(x) = d #sqrt{#frac{2}{#lambdaD}} \ #int^{x}cos(#frac{#pi}{2}t^{2})dt"); l.DrawLatex(0.1,0.5,"3) R = |A|^{2} = #frac{1}{2}#left(#[]{#frac{1}{2}+\ C(V)}^{2}+#[]{#frac{1}{2}+S(V)}^{2}#right)"); l.DrawLatex(0.1,0.3,"4) F(t) = #sum_{i=-#infty}^{#infty}A(i)cos#[]\ {#frac{i}{t+i}}"); l.DrawLatex(0.1,0.1,"5) {}_{3}^{7}Li"); c1->Print("latex.ps"); } |
|
