DESCRIPTION
ROOT R is an interface in ROOT to call R functions using an R C++ interface (Rcpp, see http://dirk.eddelbuettel.com/code/rcpp.html). This interface opens the possibility in ROOT to use the very large set of mathematical and statistical tools provided by R. With ROOTR you can perform a conversion from ROOT's C++ objects to R's objects, transform the returned R objects into ROOT's C++ objects, then the R functionality can be used directly for statistical studies in ROOT.
ROOTR BASICS
ROOTR creates a working environment to execute R coding called from C++. It allows to translate some datatypes from C++ to R inside the R environment and vice versa in an easy way to get the most from both R and ROOT. To ease the sending and receiving of data in both environments, I overloaded the operators <<,>> and [] which make look the job as a flow of data between environments, we will see more of that later. With this tool you ca use any library or R package wich allows you to access a big amount of benefits to make statistical analysis. ROOTR also has a R events processing system, which allows to use the R graphical system from C++.
INSTALLATION
To install ROOTR please read first.
COMPILING ROOTR ON MAC WITH CMAKE:
NOTE: Mac OSX Yosemite last xcode and without macports
Prerequisites
To compile with cmake added into ~/.profile
export PATH=$PATH:/Applications/CMake.app/Contents/bin/
and
Install needed R packages, open R and in the prompt type
install.packages(c('Rcpp','RInside'))
select a mirror and install.
Install the next additional packages for R TMVA interface
install.packages(c('C50','RSNNS','e1071','xgboost'))
Download code from git repo
git clone http://root.cern.ch/git/root.git
To compile ROOTR lets to create a compilation directory and to activate it use cmake -Dr=ON ..
mkdir compile
cd compile
cmake -Dr=ON ..
make -j 5
Compiling ROOTR on Gnu/Linux with CMake:
NOTE: Tested on Gnu/Linux Debian Jessie with gcc 4.9
Prerequisities install (For debian-based distros)
apt-get install r-base r-base-dev
Install needed R packages, open R and in the prompt type
install.packages(c('Rcpp','RInside'))
select a mirror and install.
Install the next additional packages for R TMVA interface
install.packages(c('C50','RSNNS','e1071','xgboost'))
Download code from git repo
git clone http://root.cern.ch/git/root.git
To compile ROOTR lets to create a compilation directory and to activate it use cmake -Dr=ON ..
mkdir compile
cd compile
cmake -Dr=ON ..
make -j 5
How does it work ?
There is a class called TRInterface which is located at the header TRInterface.h and uses the namespace ROOT::R, it is in charge of making calls to R to give and obtain data. This class has a series of overcharged operators which ease the passing and obtaining of data and code from R to C++ and vice versa. To create an object of this class the user must use the static methods ROOT::R::TRInterface::Instance and ROOT::R::TRInterface::InstancePtr which return a reference object and a pointer object respectively.
Option_t Option_t TPoint TPoint const char GetTextMagnitude GetFillStyle GetLineColor GetLineWidth GetMarkerStyle GetTextAlign GetTextColor GetTextSize void char Point_t Rectangle_t WindowAttributes_t Float_t r
ROOT R was implemented using the R Project library and the modules Rcpp and RInside
static TRInterface & Instance()
static method to get an TRInterface instance reference
Running R code and passing/getting variables.
We have different ways to run R code and pass/obtain data to/from R environment: using the methods Execute(code) and Eval(code).
r<<
"print('hello ROOTR')";
r<<
"vec=c(1,2,3)"<<
"print(vec)";
r.Execute(
"print('hello ROOTR')");
std::vector<Int_t>
v=
r.Eval(
"c(1,2,3)");
std::cout<<
v[0]<<
" "<<
v[1]<<
" "<<
v[2]<<std::endl;
std::vector<Double_t>
vd(3);
std::cout<<
vd[0]<<
" "<<
vd[1]<<
" "<<
vd[2]<<std::endl;
std::vector<Int_t>
v1(3);
r<<
"mat<-matrix(c(0.1,0.2,0.3,0.4),nrow=2)";
ROOT::Detail::TRangeCast< T, true > TRangeDynCast
TRangeDynCast is an adapter class that allows the typed iteration through a TCollection.
void Print(Option_t *option="") const override
Dump this marker with its attributes.
So, working with ROOTR is like working with flows of data to pass, obtain and process data.
Passing functions from ROOT to R
You can pass functions from ROOT to R using the operators << and = or using the class TRFunction, but the arguments and datatypes of the return value cannot be pointers. They must be ROOTR supported datatypes. So instead of using *Double_t you must use std::vector and instead of *Char_t use TString or std::string.
For this example we need to create a macro, so save it as fun.C
{
}
{
}
{
r<<
"print(myfun2(c(0,4)))";
}
This is a class to pass functions from ROOT to R.
Double_t DiLog(Double_t x)
Modified Struve functions of order 1.
IMPORTANT
- For overloaded functions you should pass the function with a explicit cast to the wanted function.
- The system works with templates and the template can not resolve the correct type of function because it is overloaded.
- If you pass a function without the explicit cast you will get a very ugly traceback.
- A lot of common standard functions for example from math.h like sin, cos etc.. are overloaded, take care passing it.
Wrapping a class
You can wrap a class and expose it in R environment using only a pair of macrodefinitions and the template class ROOT::R::class_<> The ROOTR_EXPOSED_CLASS(Class) macro allows you to expose the class as a new datatype of R, but it has to be alongside the ROOTR_MODULE(Module) macro which allows you to create an internal R module and make the class wrapping To do this you must use inside the ROOTR_MODULE braces the class ROOT::R::class_<> and specify each constructor, attribute or method that the class to export has. Then the macrodefinition LOAD_ROOTR_MODULE(Module) can load the module and the class in R's environment. You can find a more clear instruction by looking at a example below in Functor section.
DataFrames
DataFrame? is a very important datatype in R and in ROOTR we have a class to manipulate dataframes called TRDataFrame, with a lot of very useful operators overloaded to work with TRDataFrame's objects in a similar way that in the R environment but from c++ in ROOT. Example:
Lets to create need data to play with dataframe features
std::vector<Double_t>
v2(3);
std::array<Int_t,3>
v3{ {1,2,3} };
std::list<std::string> names;
names.push_back("v1");
names.push_back("v2");
names.push_back("v3");
In R the dataframe have associate to every column a label, in ROOTR you can have the same label using the class ROOT::R::Label to create a TRDataFrame where you data have a label associate.
This is a class to create DataFrames from ROOT to R.
const Rcpp::internal::NamedPlaceHolder & Label
Output
var1 var2 var3 strings
1 1 0.101 1 v1
2 2 0.202 2 v2
3 3 0.303 3 v3
Manipulating data between dataframes
Output
var1 var2 var3 strings var4
1 1 0.101 1 v1 -1
2 2 0.202 2 v2 -2
3 3 0.303 3 v3 -3
Getting data frames from R's environment
r<<
"df2<-data.frame(v1=c(0.1,0.2,0.3),v2=c(3,2,1))";
Output
Vector (3) is as follows
| 1 |
------------------
0 |0.1
1 |0.2
2 |0.3
Vector (3) is as follows
| 1 |
------------------
0 |3
1 |2
2 |1
Output
v1 v2 v3
1 0.1 3 v1
2 0.2 2 v2
3 0.3 1 v3
Output
var1 var2 var3 strings var4
1 v1 0.101 1 v1 -1
2 v2 0.202 2 v2 -2
3 v3 0.303 3 v3 -3
Plotting with R's graphical system.
ROOTR supports an eventloop for R's graphical system which allows plotting using the R functions to the graphical system or generating images(ps, pdf png, etc). You can find a demo in Interpolation below in examples section.
Interactive Mode
The interactive mode lets you get the R's command line within ROOT's command line to run R code with tab completion support. The variables created in the interactive mode can be passed to ROOT with TRObjectProxy and the method ParseEval?. To initialize the interactive mode just call Interactive() method and type ".q" to exit from R's prompt and to go to the ROOT's prompt again.
| 1 |
------------------
0 |1
1 |1.5
2 |2
3 |2.5
4 |3
5 |3.5
6 |4
7 |4.5
8 |5
root [4]
Examples
The examples can also be found in $ROOTSYS/tutorials/r
Creating a Functor
A functor is a class which wraps a function, very useful when states and properties associated to that function are needed. In this example I show how to give support to a custom class to be used in R's environment, which at the same time is a functor.
public:
status=false;
}
{
status=true;
}
}
private:
};
.constructor()
.method( "getStatus", &MyFunctor::getStatus)
;
}
{
r<<
"MyFunctor <- MyFunctorModule$MyFunctor";
r<<
"u <- new(MyFunctor)";
r<<
"print(u$getStatus())";
r<<
"print(sprintf('value in R = %f',u$doEval( 1 )))";
r<<
"print(functor$getStatus())";
r<<
"print(sprintf('value in R = %f',functor$doEval( 1 )))";
std::cout<<
"value in ROOT = "<<
TMath::Erf(1)<<std::endl;
}
#define ROOTR_EXPOSED_CLASS
#define LOAD_ROOTR_MODULE(NAME)
Double_t(* Function)(Double_t)
Double_t doEval(Double_t x)
Double_t Erf(Double_t x)
Computation of the error function erf(x).
Double_t BesselY1(Double_t x)
Bessel function Y0(x) for positive x.
Simple fitting in R and plot in ROOT
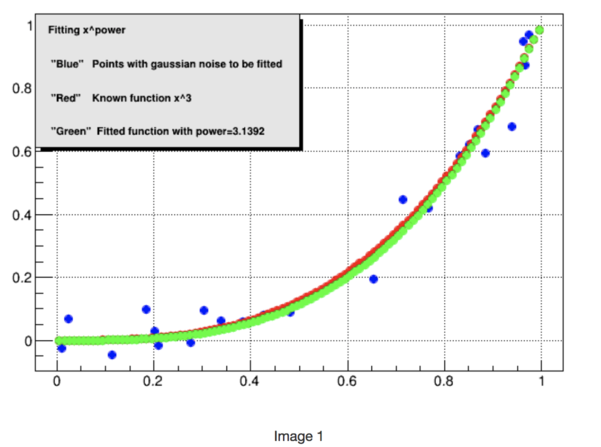
The next example creates an exponential fit. The idea is to create a set of numbers x,y with noise from ROOT, pass them to R and fit the data to x^3, get the fitted coefficient(power) and plot the data, the known function and the fitted function using ROOT's classes.
for (
Int_t i = 0; i <
n; i++) {
x1[i] =
rg.Uniform(0, 1);
}
r<<
"ds<-data.frame(x=x,y=y)";
r<<
"m <- nls(y ~ I(x^power),data = ds, start = list(power = 1),trace = T)";
r[
"summary(m)$coefficients[1]"]>>
power;
pt->
AddText(
" \"Blue\" Points with gaussian noise to be fitted");
fmsg.Form(
" \"Green\" Fitted function with power=%.4lf",
power);
}
Option_t Option_t TPoint TPoint const char x1
Option_t Option_t TPoint TPoint const char y1
TVectorT< Double_t > TVectorD
virtual void SetFillColor(Color_t fcolor)
Set the fill area color.
virtual void SetTextAlign(Short_t align=11)
Set the text alignment.
A TGraph is an object made of two arrays X and Y with npoints each.
A TMultiGraph is a collection of TGraph (or derived) objects.
virtual void Add(TGraph *graph, Option_t *chopt="")
Add a new graph to the list of graphs.
void Draw(Option_t *chopt="") override
Draw this multigraph with its current attributes.
A Pave (see TPave) with text, lines or/and boxes inside.
virtual TText * AddText(Double_t x1, Double_t y1, const char *label)
Add a new Text line to this pavetext at given coordinates.
void Draw(Option_t *option="") override
Draw this pavetext with its current attributes.
This is the base class for the ROOT Random number generators.
LongDouble_t Power(LongDouble_t x, LongDouble_t y)
Returns x raised to the power y.
In the first image you can see the blue dots which are the function x^3 with gaussian noise, the red dots correspond to the original function and the green ones correspond to the fitted function.
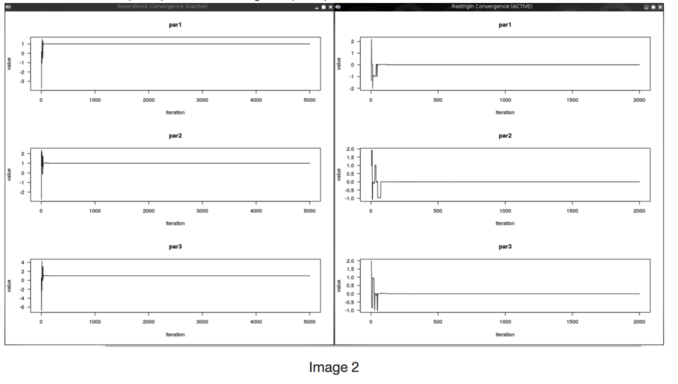
Global Minimization in R using the package DEoptim
DEoptim is a R package for Differential Evolution Minimization that lets you do global Minimization. To install this package you just need to run:
r<<
"install.packages('DEoptim',repos='http://cran.rstudio.com/')";
Then create a macro named GlobalMinimization.C with the next code.
#include<math.h>
#include<stdlib.h>
{
{
}
}
{
{
}
}
{
{
std::cout<<"Package DEoptim no installed in R"<<std::endl;
std::cout<<"Run install.packages('DEoptim') in R's environment"<<std::endl;
return;
}
r<<
"suppressMessages(library(DEoptim, quietly = TRUE))";
bench.Start(
"GlobalMinimizationRosenBrock");
r<<
"result1<-DEoptim(fn=GenRosenBrock,lower=ll,upper=ul,control=list(NP=10*n,itermax=MaxIter,trace=FALSE))";
std::cout<<"-----------------------------------------"<<std::endl;
std::cout<<"RosenBrock's minimum in: "<<std::endl;
r<<
"print(result1$optim$bestmem)";
std::cout<<"Bechmark Times"<<std::endl;
bench.Show(
"GlobalMinimizationRosenBrock");
bench.Start(
"GlobalMinimizationRastrigin");
r<<
"result2<-DEoptim(fn=Rastrigin,lower=ll,upper=ul,control=list(NP=10*n,itermax=MaxIter,trace=FALSE))";
std::cout<<"-----------------------------------------"<<std::endl;
std::cout<<"Rastrigin's minimum in: "<<std::endl;
r<<
"print(result2$optim$bestmem)";
std::cout<<"Bechmark Times"<<std::endl;
bench.Show(
"GlobalMinimizationRastrigin");
r<<
"dev.new(title='RosenBrock Convergence')";
r<<
"plot(result1,type='o',pch='.')";
r<<
"dev.new(title='Rastrigin Convergence')";
r<<
"plot(result2,type='o',pch='.')";
}
Option_t Option_t TPoint TPoint const char GetTextMagnitude GetFillStyle GetLineColor GetLineWidth GetMarkerStyle GetTextAlign GetTextColor GetTextSize void char Point_t Rectangle_t WindowAttributes_t Float_t Float_t Float_t Int_t Int_t UInt_t UInt_t Rectangle_t result
Option_t Option_t TPoint TPoint const char GetTextMagnitude GetFillStyle GetLineColor GetLineWidth GetMarkerStyle GetTextAlign GetTextColor GetTextSize void char Point_t Rectangle_t WindowAttributes_t Float_t Float_t Float_t Int_t Int_t UInt_t UInt_t Rectangle_t Int_t Int_t Window_t TString Int_t GCValues_t GetPrimarySelectionOwner GetDisplay GetScreen GetColormap GetNativeEvent const char const char dpyName wid window const char font_name cursor keysym reg const char only_if_exist regb h Point_t winding char text const char depth char const char Int_t count const char ColorStruct_t color const char Pixmap_t Pixmap_t PictureAttributes_t attr const char char ret_data h unsigned char height h length
This class is a ROOT utility to help benchmarking applications.
In the image you can see the convergence plots of the functions and their minimum. For RosenBrock is (1,1,1) and for Rastrigin is (0,0,0).
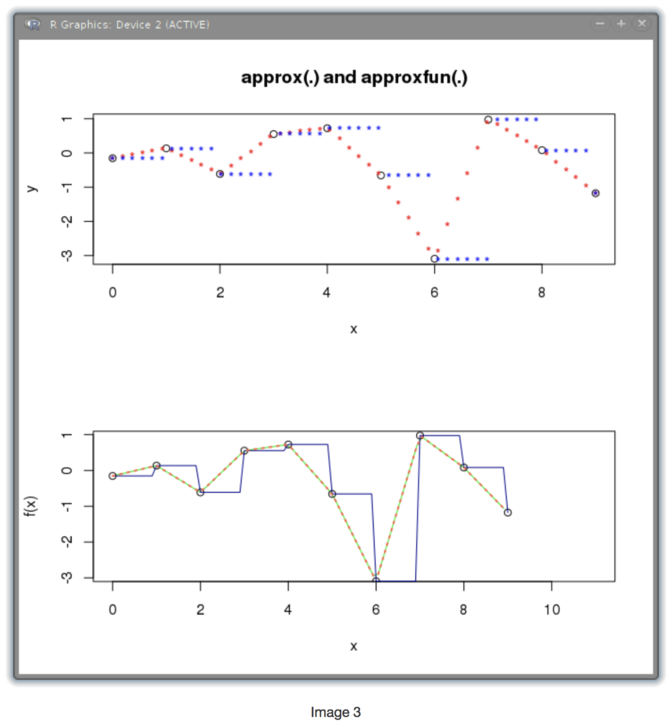
Interpolation (Plotting in R)
This example shows an interpolation using the function aproxfun and how to make a plot with R's graphical functions.
More Information on R interpolation here.
#include<vector>
void Interpolation()
{
std::vector<Double_t>
x(10),
y(10);
for(int i=0;i<10;i++)
{
}
r<<
"par(mfrow = c(2,1))";
r<<
"plot(x, y, main = 'approx(.) and approxfun(.)')";
r<<
"points(approx(x, y), col = 2, pch = '*')";
r<<
"points(approx(x, y, method = 'constant'), col = 4, pch = '*')";
r<<
"f <- approxfun(x, y)";
r<<
"curve(f(x), 0, 11, col = 'green2')";
r<<
"fc <- approxfun(x, y, method = 'const')";
r<<
"curve(fc(x), 0, 10, col = 'darkblue', add = TRUE)";
r<<
"plot(approxfun(x, y, rule = 2:1), 0, 11,col = 'tomato', add = TRUE, lty = 3, lwd = 2)";
}
The image shows the interpolated function plotted within R:
Integration (Passing vectorized function to R)
Numerical integration using R passing the function from ROOT
{
std::vector<Double_t>
result(
xx.size());
{
}
}
}
{
Double_t value=
r.Eval(
"integrate(BreitWigner, lower = -2, upper = 2)$value");
std::cout.precision(18);
std::cout<<
"Integral of the BreitWigner Function in the interval [-2, 2] R = "<<
value<<std::endl;
std::cout<<
"Integral of the BreitWigner Function in the interval [-2, 2] MathMore = "<<
value<<std::endl;
TF1 f1(
"BreitWigner",
"BreitWignerWrap(x)");
std::cout<<
"Integral of the BreitWigner Function in the interval [-2, 2] TF1 = "<<
value<<std::endl;
value=
r.Eval(
"integrate(BreitWigner, lower = -Inf, upper = Inf)$value");
std::cout<<
"Integral of BreitWigner Function in the interval [-Inf, Inf] R = "<<
value<<std::endl;
}
Option_t Option_t TPoint TPoint const char GetTextMagnitude GetFillStyle GetLineColor GetLineWidth GetMarkerStyle GetTextAlign GetTextColor GetTextSize void value
User Class for performing numerical integration of a function in one dimension.
Template class to wrap any C++ callable object which takes one argument i.e.
virtual Double_t Integral(Double_t a, Double_t b, Double_t epsrel=1.e-12)
IntegralOneDim or analytical integral.
Double_t BreitWigner(Double_t x, Double_t mean=0, Double_t gamma=1)
Calculates a Breit Wigner function with mean and gamma.
Users Guide Sites