Loading [MathJax]/extensions/tex2jax.js
Logo ROOT   6.14/05
Reference Guide
All Classes Namespaces Files Functions Variables Typedefs Enumerations Enumerator Properties Friends Macros Modules Pages
exclusiongraph2.C File Reference

Detailed Description

View in nbviewer Open in SWAN 
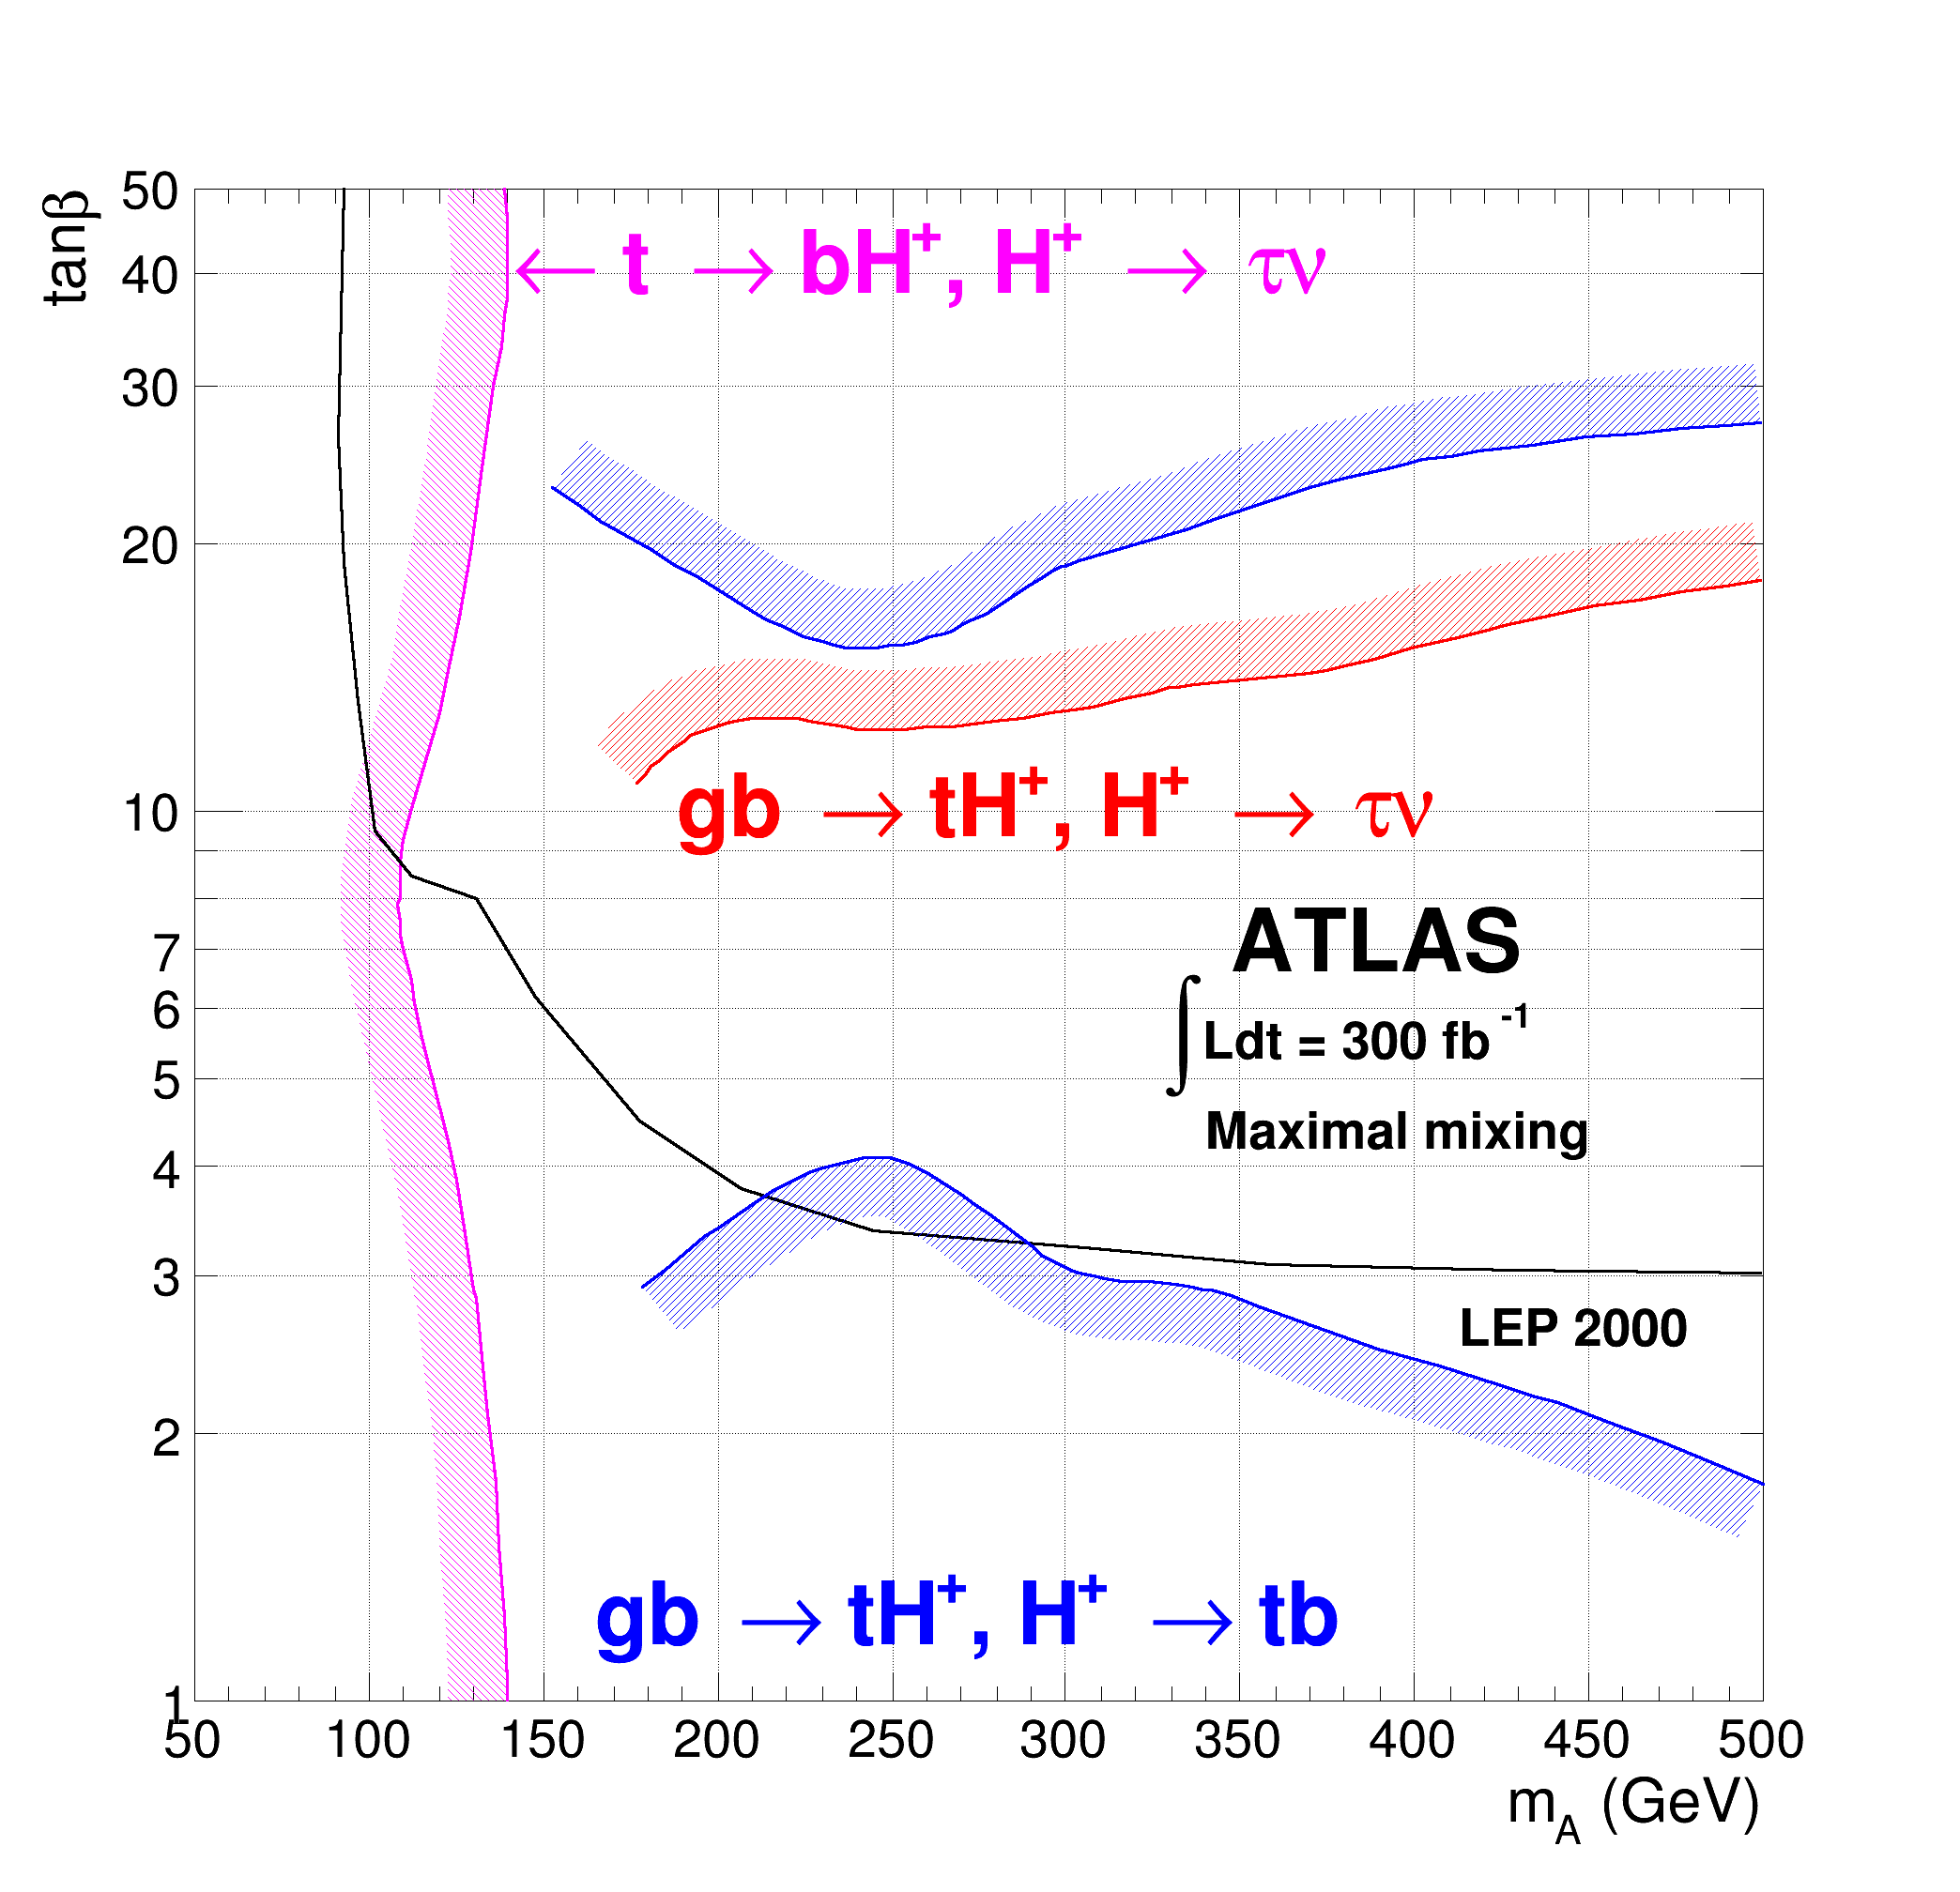
Draw several graphs with an exclusion zones.

pict1_exclusiongraph2.C.png
void exclusiongraph2()
{
TCanvas *c = new TCanvas("c",
"Charged Higgs L300 Contour",0,0,700,700);
c->SetTickx();
c->SetTicky();
c->SetGridx();
c->SetGridy();
TH1 *frame = new TH1F("frame","",1000,50,500);
frame->SetMinimum(1);
frame->SetMaximum(50);
frame->SetDirectory(0);
frame->SetStats(0);
frame->GetXaxis()->SetTitle("m_{A} (GeV)");
frame->GetXaxis()->SetTickLength(0.02);
frame->GetXaxis()->SetLabelSize(0.03);
frame->GetYaxis()->SetTitle("tan#beta");
frame->GetYaxis()->SetLabelSize(0.03);
frame->Draw(" ");
c->SetLogy();
TGraph *gr1 = new TGraph(10);
gr1->SetFillColor(6);
gr1->SetFillStyle(3005);
gr1->SetLineColor(6);
gr1->SetLineWidth(603);
gr1->SetPoint(0,140,0.5);
gr1->SetPoint(1,130,2.9);
gr1->SetPoint(2,124.677,3.83726);
gr1->SetPoint(3,113.362,6.06903);
gr1->SetPoint(4,108.513,8.00221);
gr1->SetPoint(5,111.746,10.0272);
gr1->SetPoint(6,119.828,12.8419);
gr1->SetPoint(7,135.991,30.0872);
gr1->SetPoint(8,140,40);
gr1->SetPoint(9,135,60);
gr1->Draw("C");
TLatex *tex = new TLatex(140.841,37.9762,
"#leftarrow t #rightarrow bH^{+}, H^{+} #rightarrow #tau#nu");
tex->SetTextColor(6);
tex->Draw();
TGraph *gr2 = new TGraph(15);
gr2->SetName("Graph");
gr2->SetTitle("Graph");
gr2->SetFillColor(1);
gr2->SetFillStyle(3005);
gr2->SetLineWidth(3);
gr2->SetPoint(0,499.192,3.02622);
gr2->SetPoint(1,427.748,3.06233);
gr2->SetPoint(2,358.244,3.10722);
gr2->SetPoint(3,305.711,3.24589);
gr2->SetPoint(4,244.289,3.36617);
gr2->SetPoint(5,206.304,3.7544);
gr2->SetPoint(6,178.017,4.50347);
gr2->SetPoint(7,148.114,6.20297);
gr2->SetPoint(8,131.142,8.00221);
gr2->SetPoint(9,111.746,8.48188);
gr2->SetPoint(10,102.047,9.52921);
gr2->SetPoint(11,96.3901,13.2212);
gr2->SetPoint(12,92.3491,19.0232);
gr2->SetPoint(13,90.7328,26.3935);
gr2->SetPoint(14,93.1573,50.4385);
gr2->Draw("L");
tex = new TLatex(346.929,6.62281,"ATLAS");
tex->SetLineWidth(2);
tex->Draw();
tex = new TLatex(328.341,5.24703,"#intLdt = 300 fb^{-1}");
tex->SetTextSize(0.0297619);
tex->SetLineWidth(2);
tex->Draw();
tex = new TLatex(340.463,4.1874,"Maximal mixing");
tex->SetTextSize(0.0297619);
tex->SetLineWidth(2);
tex->Draw();
tex = new TLatex(413.2,2.51608,"LEP 2000");
tex->SetTextSize(0.0297619);
tex->SetLineWidth(2);
tex->Draw();
TGraph *gr3 = new TGraph(10);
gr3->SetName("Graph");
gr3->SetTitle("Graph");
gr3->SetFillColor(2);
gr3->SetFillStyle(3004);
gr3->SetLineColor(2);
gr3->SetLineWidth(603);
gr3->SetPoint(0,176.84,10.7499);
gr3->SetPoint(1,190.575,11.9912);
gr3->SetPoint(2,211.58,12.7108);
gr3->SetPoint(3,243.088,12.3457);
gr3->SetPoint(4,279.443,12.6185);
gr3->SetPoint(5,302.065,12.9916);
gr3->SetPoint(6,331.957,13.7713);
gr3->SetPoint(7,369.928,14.2821);
gr3->SetPoint(8,425.673,16.1651);
gr3->SetPoint(9,499.192,18.1635);
gr3->Draw("C");
tex = new TLatex(188.151,9.36035,
"gb #rightarrow tH^{+}, H^{+} #rightarrow #tau#nu");
tex->SetTextColor(2);
tex->Draw();
TGraph *gr4 = new TGraph(10);
gr4->SetName("Graph");
gr4->SetTitle("Graph");
gr4->SetFillColor(4);
gr4->SetFillStyle(3004);
gr4->SetLineColor(4);
gr4->SetLineWidth(-603);
gr4->SetPoint(0,178.456,2.91797);
gr4->SetPoint(1,200.269,3.40033);
gr4->SetPoint(2,229.354,3.96243);
gr4->SetPoint(3,249.551,4.07959);
gr4->SetPoint(4,269.749,3.71097);
gr4->SetPoint(5,298.025,3.09308);
gr4->SetPoint(6,341.652,2.89679);
gr4->SetPoint(7,378.007,2.57808);
gr4->SetPoint(8,441.023,2.16454);
gr4->SetPoint(9,499.677,1.76145);
gr4->Draw("C");
tex = new TLatex(165.,1.15498,
"gb #rightarrow tH^{+}, H^{+} #rightarrow tb");
tex->SetTextColor(4);
tex->Draw();
TGraph *gr5 = new TGraph(10);
gr5->SetName("Graph");
gr5->SetTitle("Graph");
gr5->SetFillColor(4);
gr5->SetFillStyle(3004);
gr5->SetLineColor(4);
gr5->SetLineWidth(603);
gr5->SetPoint(0,152.603,23.0996);
gr5->SetPoint(1,188.151,18.8373);
gr5->SetPoint(2,239.048,15.2499);
gr5->SetPoint(3,264.901,15.8156);
gr5->SetPoint(4,299.641,18.8373);
gr5->SetPoint(5,334.381,20.7085);
gr5->SetPoint(6,360.233,22.4362);
gr5->SetPoint(7,396.589,24.4859);
gr5->SetPoint(8,433.752,25.7669);
gr5->SetPoint(9,499.192,27.3132);
gr5->Draw("C");
}
Author
Olivier Couet

Definition in file exclusiongraph2.C.