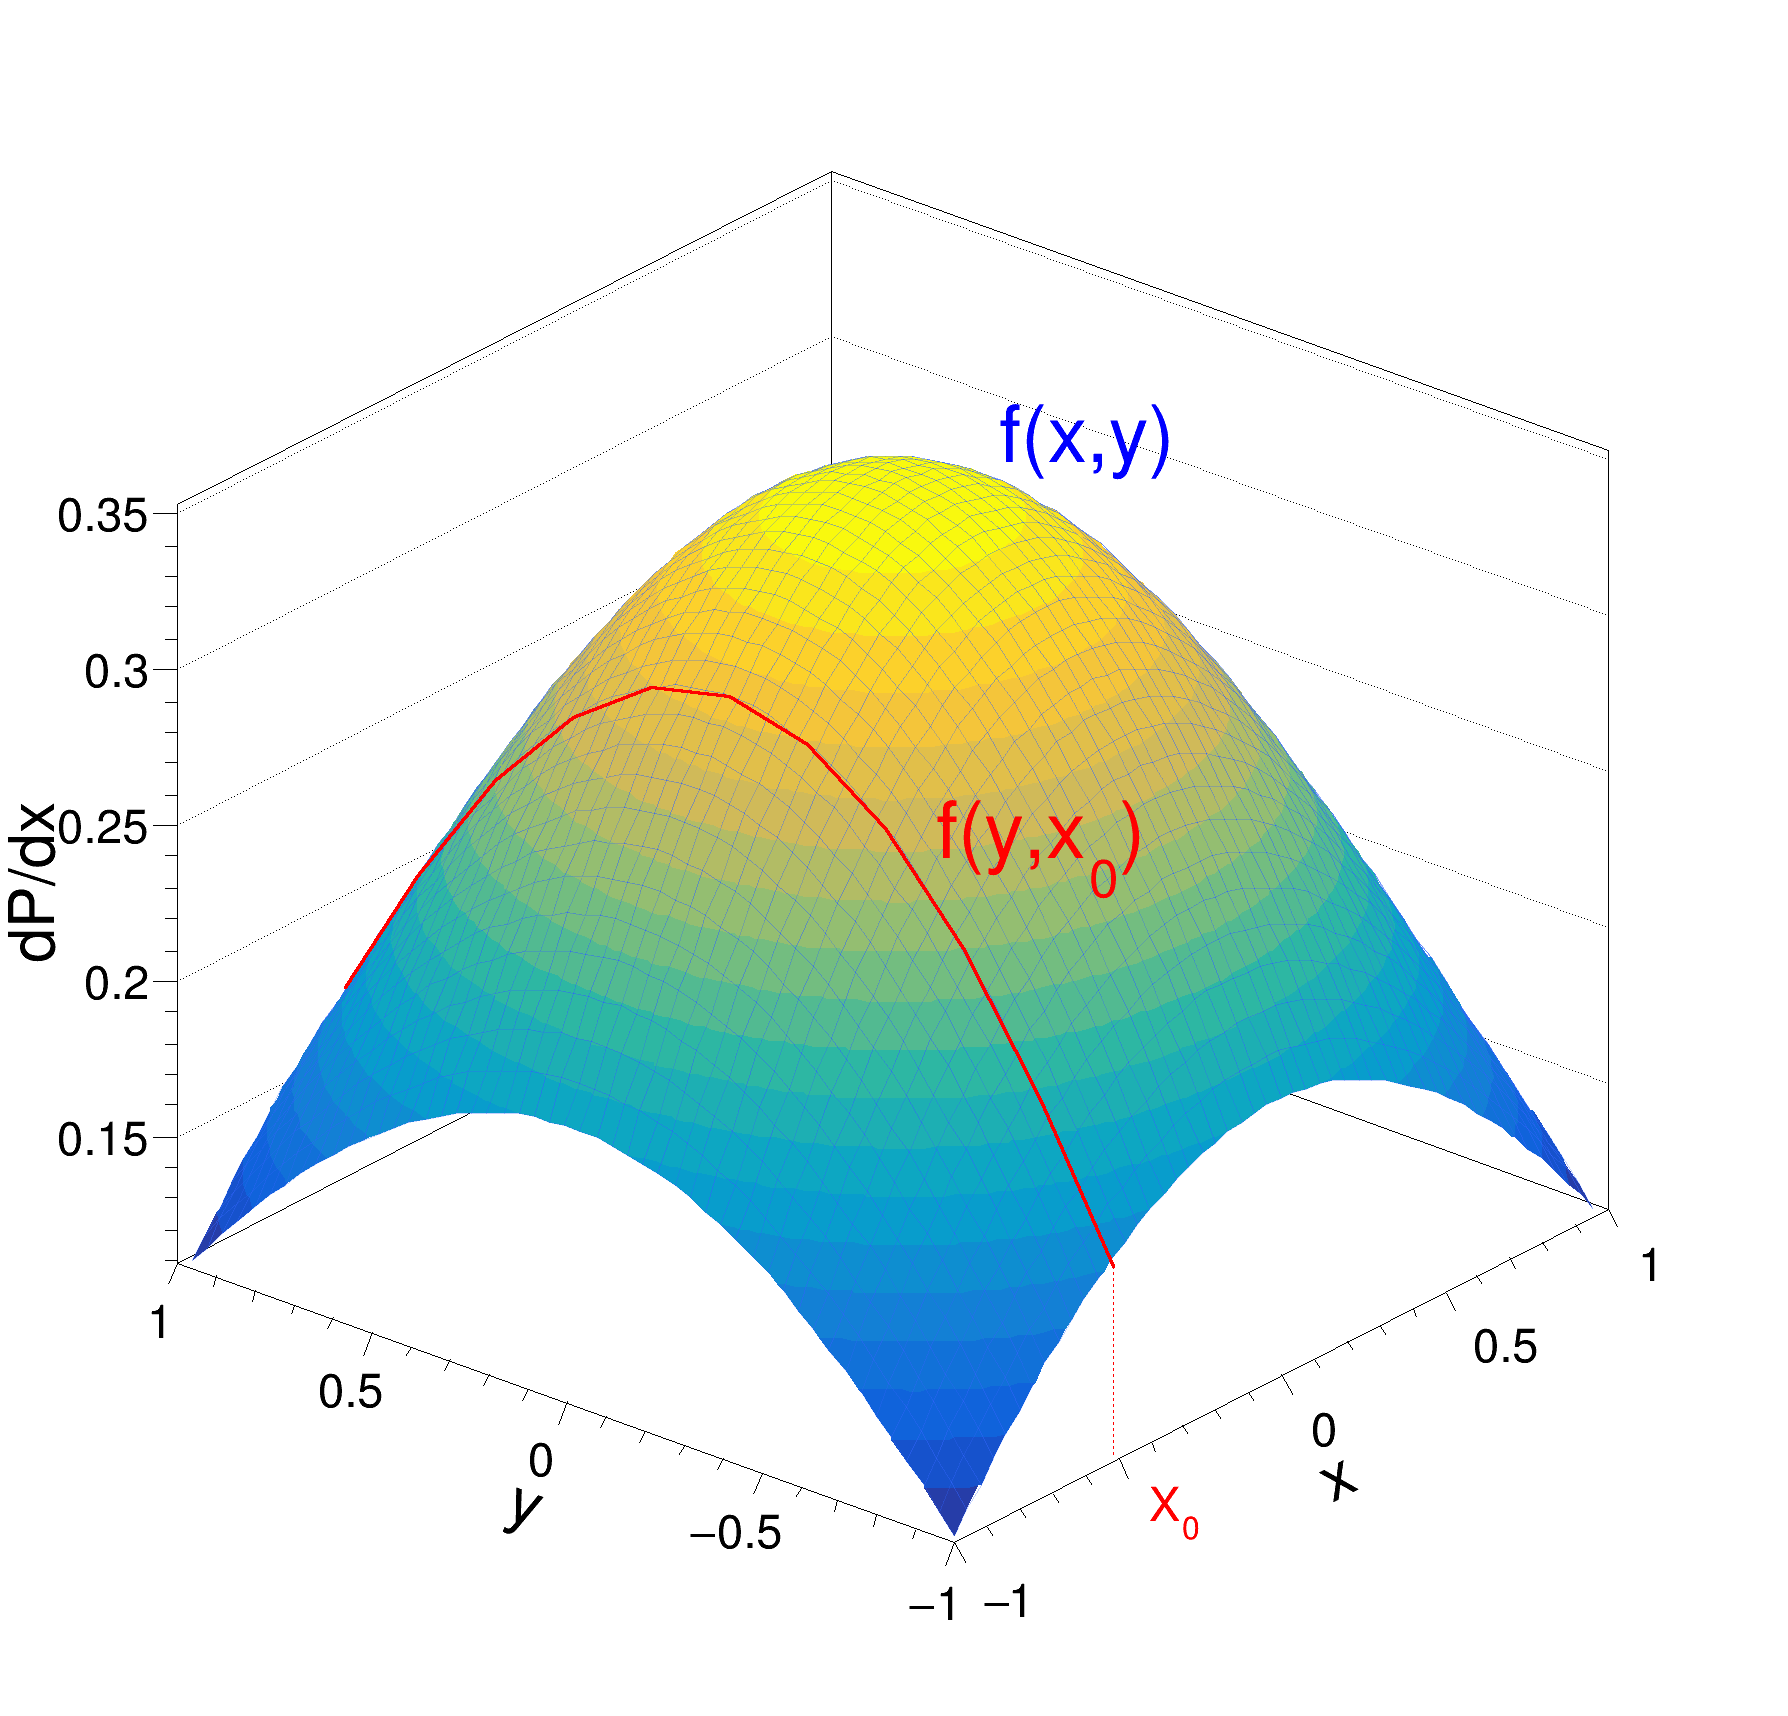
 This example show how to put some annotation on a 3D plot using 3D polylines.
It also demonstrates how the axis labels can be modified. It was created for the book: Statistical Methods for Data Analysis in Particle Physics
void annotation3d()
{
TF2 *f =
new TF2(
"f",
"[0]*cos(x)*cos(y)", -1, 1, -1, 1);
double s = 1./f->
Integral(-1, 1, -1, 1);
double x[11] = {-0.500, -0.5, -0.5, -0.5, -0.5, -0.5, -0.5, -0.5, -0.5, -0.5, -0.500};
double y[11] = {-0.985, -0.8, -0.6, -0.4, -0.2, 0.0, 0.2, 0.4, 0.6, 0.8, 0.985};
double z[11];
for (
int i = 0; i < 11; ++i) z[i] = s*
cos(x[i])*
cos(y[i]);
double xx[2] = {-0.5, -0.5};
double yy[2] = {-0.985, -0.985};
double zz[2] = {0.11, s*
cos(-0.5)*
cos(-0.985)};
}
- Author
- Luca Lista
Definition in file annotation3d.C.


 This example show how to put some annotation on a 3D plot using 3D polylines.