 |
ROOT 6.12/07 Reference Guide |
| |
ROOT 6.12/07 Reference Guide |
Namespaces | |
| ratioplot5 | |

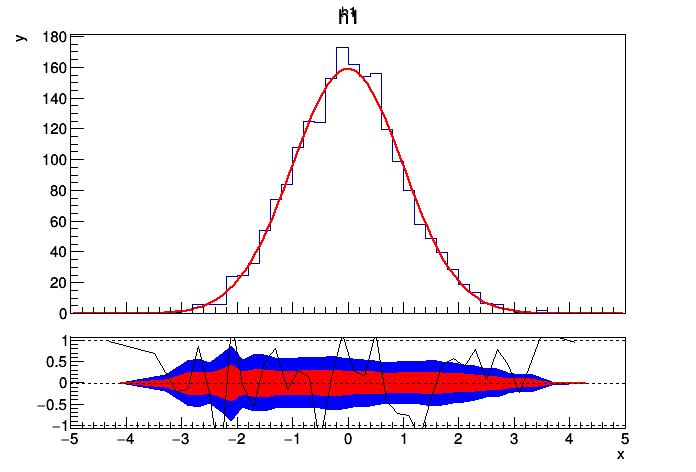
![]() Example that shows how you can set the colors of the confidence interval bands by using the method
Example that shows how you can set the colors of the confidence interval bands by using the method TRatioPlot::SetConfidenceIntervalColors.
Inspired by the tutorial of Paul Gessinger.
Definition in file ratioplot5.py.
 ROOT 6.12/07 - Reference Guide Generated on Sat Sep 29 2018 23:41:54 (GVA Time) using Doxygen 1.8.13.