 |
ROOT 6.12/07 Reference Guide |
| |
ROOT 6.12/07 Reference Guide |
Namespaces | |
| ratioplot2 | |

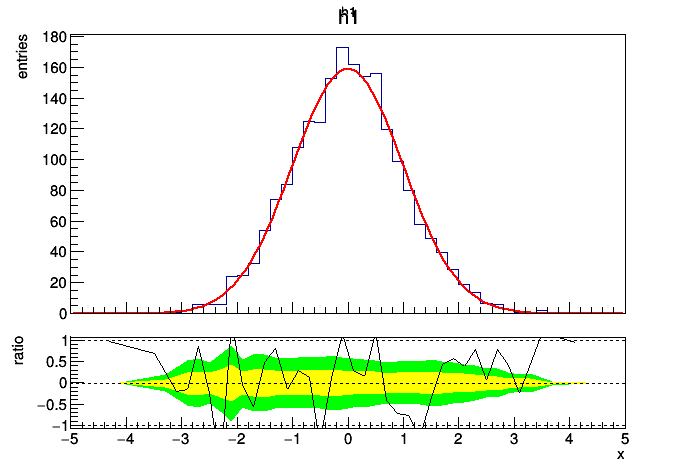
![]() Example of a fit residual plot.
Example of a fit residual plot.
Creates a histogram filled with random numbers from a gaussian distribution and fits it with a standard gaussian function. The result is passed to the TRatioPlot constructor. Additionally, after calling TRatioPlot::Draw the upper and lower y axis titles are modified. Confidence interval bands are automatically drawn on the bottom (but can be disabled by draw option nobands. nspired by the tutorial of Paul Gessinger.
Definition in file ratioplot2.py.
 ROOT 6.12/07 - Reference Guide Generated on Sat Sep 29 2018 23:41:54 (GVA Time) using Doxygen 1.8.13.