Logo ROOT   6.10/09
Reference Guide
ratioplotOld.C File Reference

Detailed Description

Example displaying two histograms and their ratio.

This macro does not use the class TRatioPlot. For ROOT version >= 6.08 TRatioPlot should be used. See the other ratio plots examples in this folder.

pict1_ratioplotOld.C.png
void ratioplotOld( ) {
// Define two gaussian histograms. Note the X and Y title are defined
// at booking time using the convention "Hist_title ; X_title ; Y_title"
TH1F *h1 = new TH1F("h1", "Two gaussian plots and their ratio;x title; h1 and h2 gaussian histograms", 100, -5, 5);
TH1F *h2 = new TH1F("h2", "h2", 100, -5, 5);
h1->FillRandom("gaus");
h2->FillRandom("gaus");
// Define the Canvas
TCanvas *c = new TCanvas("c", "canvas", 800, 800);
// Upper plot will be in pad1
TPad *pad1 = new TPad("pad1", "pad1", 0, 0.3, 1, 1.0);
pad1->SetBottomMargin(0); // Upper and lower plot are joined
pad1->SetGridx(); // Vertical grid
pad1->Draw(); // Draw the upper pad: pad1
pad1->cd(); // pad1 becomes the current pad
h1->SetStats(0); // No statistics on upper plot
h1->Draw(); // Draw h1
h2->Draw("same"); // Draw h2 on top of h1
// Do not draw the Y axis label on the upper plot and redraw a small
// axis instead, in order to avoid the first label (0) to be clipped.
h1->GetYaxis()->SetLabelSize(0.);
TGaxis *axis = new TGaxis( -5, 20, -5, 220, 20,220,510,"");
axis->SetLabelFont(43); // Absolute font size in pixel (precision 3)
axis->SetLabelSize(15);
axis->Draw();
// lower plot will be in pad
c->cd(); // Go back to the main canvas before defining pad2
TPad *pad2 = new TPad("pad2", "pad2", 0, 0.05, 1, 0.3);
pad2->SetTopMargin(0);
pad2->SetBottomMargin(0.2);
pad2->SetGridx(); // vertical grid
pad2->Draw();
pad2->cd(); // pad2 becomes the current pad
// Define the ratio plot
TH1F *h3 = (TH1F*)h1->Clone("h3");
h3->SetMinimum(0.8); // Define Y ..
h3->SetMaximum(1.35); // .. range
h3->Sumw2();
h3->SetStats(0); // No statistics on lower plot
h3->Divide(h2);
h3->SetMarkerStyle(21);
h3->Draw("ep"); // Draw the ratio plot
// h1 settings
h1->SetLineColor(kBlue+1);
h1->SetLineWidth(2);
// Y axis h1 plot settings
h1->GetYaxis()->SetTitleSize(20);
h1->GetYaxis()->SetTitleFont(43);
h1->GetYaxis()->SetTitleOffset(1.55);
// h2 settings
h2->SetLineColor(kRed);
h2->SetLineWidth(2);
// Ratio plot (h3) settings
h3->SetTitle(""); // Remove the ratio title
// Y axis ratio plot settings
h3->GetYaxis()->SetTitle("ratio h1/h2 ");
h3->GetYaxis()->SetNdivisions(505);
h3->GetYaxis()->SetTitleSize(20);
h3->GetYaxis()->SetTitleFont(43);
h3->GetYaxis()->SetTitleOffset(1.55);
h3->GetYaxis()->SetLabelFont(43); // Absolute font size in pixel (precision 3)
h3->GetYaxis()->SetLabelSize(15);
// X axis ratio plot settings
h3->GetXaxis()->SetTitleSize(20);
h3->GetXaxis()->SetTitleFont(43);
h3->GetXaxis()->SetLabelFont(43); // Absolute font size in pixel (precision 3)
h3->GetXaxis()->SetLabelSize(15);
}
Author
Olivier Couet

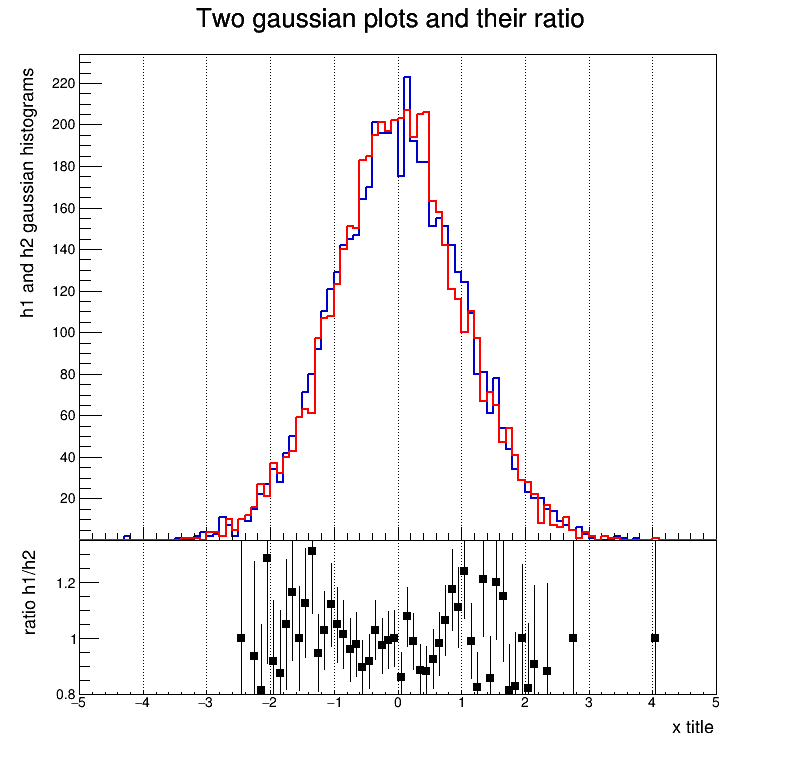
Definition in file ratioplotOld.C.