 |
ROOT 6.10/09 Reference Guide |
| |
ROOT 6.10/09 Reference Guide |

![]() Example that shows how you can set the colors of the confidence interval bands by using the method
Example that shows how you can set the colors of the confidence interval bands by using the method TRatioPlot::SetConfidenceIntervalColors.
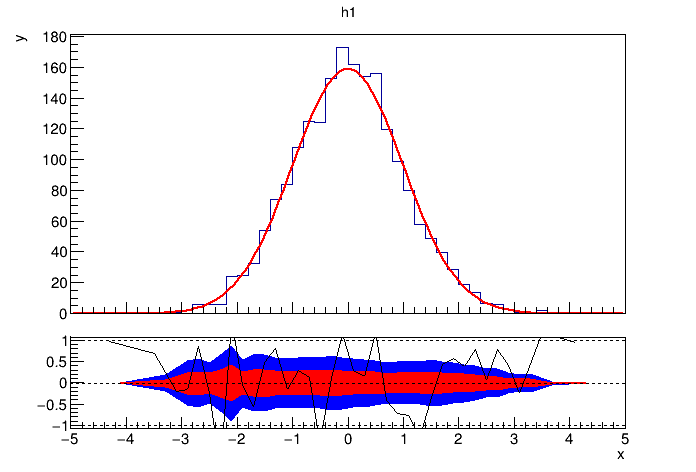
Definition in file ratioplot5.C.
 ROOT 6.10/09 - Reference Guide Generated on Thu May 31 2018 12:11:11 using Doxygen 1.8.13.