 |
ROOT 6.10/09 Reference Guide |
| |
ROOT 6.10/09 Reference Guide |

![]() Example that shows custom dashed lines on the lower plot, specified by a vector of floats.
Example that shows custom dashed lines on the lower plot, specified by a vector of floats.
By default, dashed lines are drawn at certain points. You can either disable them, or specify where you want them to appear.
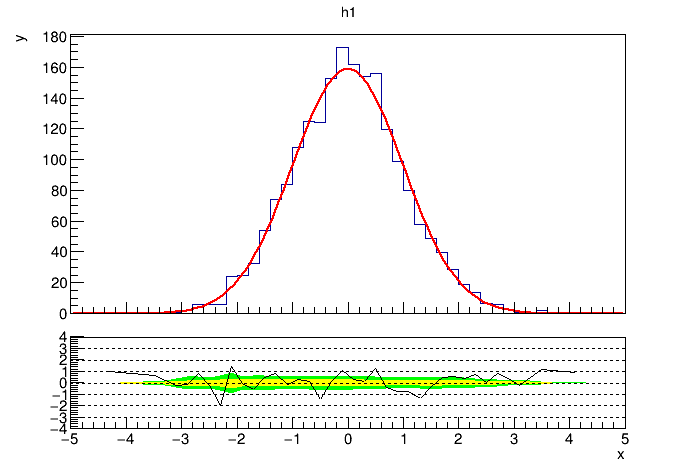
Definition in file ratioplot4.C.
 ROOT 6.10/09 - Reference Guide Generated on Thu May 31 2018 12:11:11 using Doxygen 1.8.13.