 |
ROOT 6.10/09 Reference Guide |
| |
ROOT 6.10/09 Reference Guide |

![]() Example which shows how you can get the graph of the lower plot and set the y axis range for it.
Example which shows how you can get the graph of the lower plot and set the y axis range for it.
Since the lower plot is not created until TRatioPlot::Draw is called, you can only use the method afterwards.
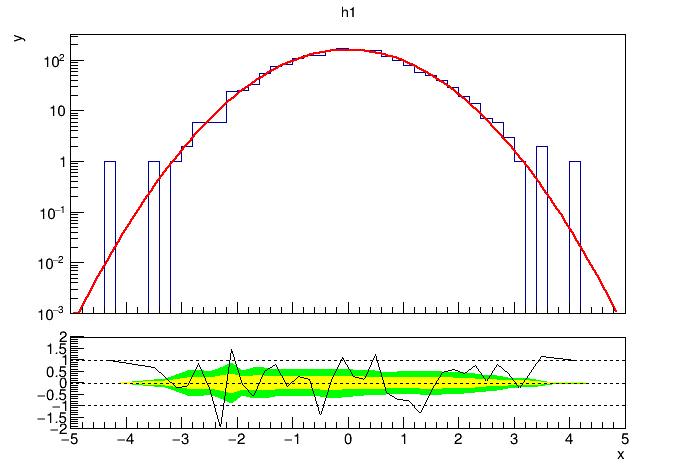
Definition in file ratioplot3.C.
 ROOT 6.10/09 - Reference Guide Generated on Thu May 31 2018 12:11:11 using Doxygen 1.8.13.