ROOT
6.10/09
Reference Guide
tutorials
math
quantiles.C File Reference
Tutorials
»
Math tutorials
Detailed Description
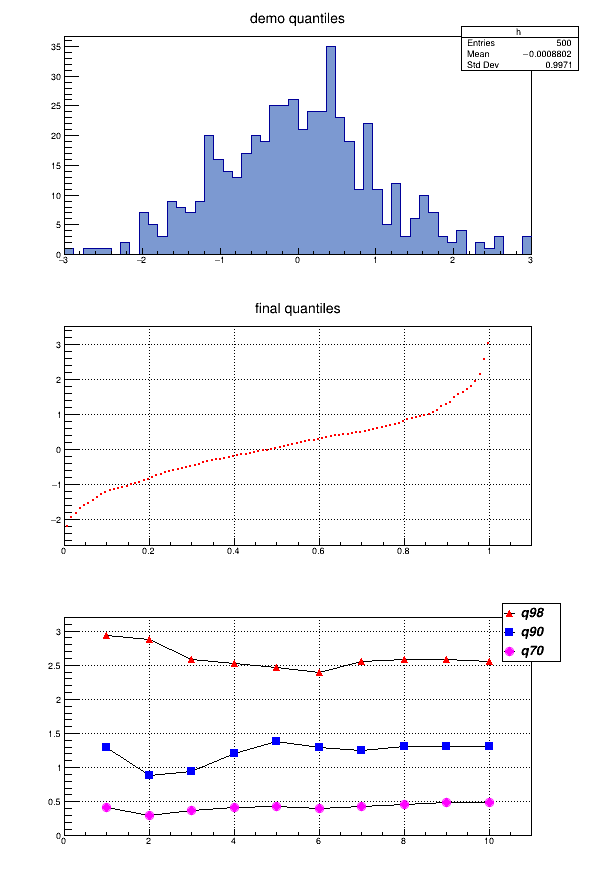
Demo for quantiles
void
quantiles() {
const
Int_t
nq = 100;
const
Int_t
nshots = 10;
Double_t
xq[nq];
// position where to compute the quantiles in [0,1]
Double_t
yq[nq];
// array to contain the quantiles
for
(
Int_t
i=0;i<nq;i++) xq[i] =
Float_t
(i+1)/nq;
TGraph
*gr70 =
new
TGraph
(nshots);
TGraph
*gr90 =
new
TGraph
(nshots);
TGraph
*gr98 =
new
TGraph
(nshots);
TH1F
*h =
new
TH1F
(
"h"
,
"demo quantiles"
,50,-3,3);
for
(
Int_t
shot=0;shot<nshots;shot++) {
h->
FillRandom
(
"gaus"
,50);
h->
GetQuantiles
(nq,yq,xq);
gr70->
SetPoint
(shot,shot+1,yq[70]);
gr90->
SetPoint
(shot,shot+1,yq[90]);
gr98->
SetPoint
(shot,shot+1,yq[98]);
}
//show the original histogram in the top pad
TCanvas
*c1 =
new
TCanvas
(
"c1"
,
"demo quantiles"
,10,10,600,900);
c1->
Divide
(1,3);
c1->
cd
(1);
h->
SetFillColor
(38);
h->
Draw
();
// show the final quantiles in the middle pad
c1->
cd
(2);
gPad
->SetGrid();
TGraph
*gr =
new
TGraph
(nq,xq,yq);
gr->
SetTitle
(
"final quantiles"
);
gr->
SetMarkerStyle
(21);
gr->
SetMarkerColor
(kRed);
gr->
SetMarkerSize
(0.3);
gr->
Draw
(
"ap"
);
// show the evolution of some quantiles in the bottom pad
c1->
cd
(3);
gPad
->DrawFrame(0,0,nshots+1,3.2);
gPad
->SetGrid();
gr98->
SetMarkerStyle
(22);
gr98->
SetMarkerColor
(kRed);
gr98->
Draw
(
"lp"
);
gr90->
SetMarkerStyle
(21);
gr90->
SetMarkerColor
(kBlue);
gr90->
Draw
(
"lp"
);
gr70->
SetMarkerStyle
(20);
gr70->
SetMarkerColor
(
kMagenta
);
gr70->
Draw
(
"lp"
);
// add a legend
TLegend
*legend =
new
TLegend
(0.85,0.74,0.95,0.95);
legend->
SetTextFont
(72);
legend->
SetTextSize
(0.05);
legend->
AddEntry
(gr98,
" q98"
,
"lp"
);
legend->
AddEntry
(gr90,
" q90"
,
"lp"
);
legend->
AddEntry
(gr70,
" q70"
,
"lp"
);
legend->
Draw
();
}
Authors
Rene Brun, Eddy Offermann
Definition in file
quantiles.C
.


 ROOT 6.10/09 - Reference Guide Generated on Thu May 31 2018 12:11:19 using Doxygen 1.8.13.