Logo ROOT   6.10/09
Reference Guide
multigraph.C File Reference

Detailed Description

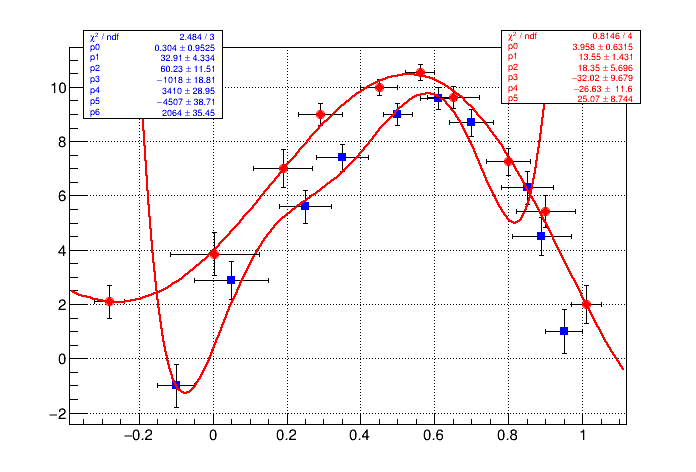
View in nbviewer Open in SWAN Create and Draw a TMultiGraph.

pict1_multigraph.C.png
void multigraph()
{
auto c1 = new TCanvas("c1","multigraph",700,500);
c1->SetGrid();
// draw a frame to define the range
auto mg = new TMultiGraph();
// create first graph
const Int_t n1 = 10;
Double_t px1[] = {-0.1, 0.05, 0.25, 0.35, 0.5, 0.61,0.7,0.85,0.89,0.95};
Double_t py1[] = {-1,2.9,5.6,7.4,9,9.6,8.7,6.3,4.5,1};
Double_t ex1[] = {.05,.1,.07,.07,.04,.05,.06,.07,.08,.05};
Double_t ey1[] = {.8,.7,.6,.5,.4,.4,.5,.6,.7,.8};
auto gr1 = new TGraphErrors(n1,px1,py1,ex1,ey1);
gr1->SetMarkerColor(kBlue);
gr1->SetMarkerStyle(21);
gr1->Fit("pol6","q");
mg->Add(gr1);
// create second graph
const Int_t n2 = 10;
Float_t x2[] = {-0.28, 0.005, 0.19, 0.29, 0.45, 0.56,0.65,0.80,0.90,1.01};
Float_t y2[] = {2.1,3.86,7,9,10,10.55,9.64,7.26,5.42,2};
Float_t ex2[] = {.04,.12,.08,.06,.05,.04,.07,.06,.08,.04};
Float_t ey2[] = {.6,.8,.7,.4,.3,.3,.4,.5,.6,.7};
auto gr2 = new TGraphErrors(n2,x2,y2,ex2,ey2);
gr2->SetMarkerColor(kRed);
gr2->SetMarkerStyle(20);
gr2->Fit("pol5","q");
mg->Add(gr2);
mg->Draw("ap");
//force drawing of canvas to generate the fit TPaveStats
c1->Update();
auto stats1 = (TPaveStats*)gr1->GetListOfFunctions()->FindObject("stats");
auto stats2 = (TPaveStats*)gr2->GetListOfFunctions()->FindObject("stats");
stats1->SetTextColor(kBlue);
stats2->SetTextColor(kRed);
stats1->SetX1NDC(0.12); stats1->SetX2NDC(0.32); stats1->SetY1NDC(0.75);
stats2->SetX1NDC(0.72); stats2->SetX2NDC(0.92); stats2->SetY1NDC(0.78);
c1->Modified();
}
Author
Rene Brun

Definition in file multigraph.C.