
 Draw parametric functions with log scales.
void logscales() {
TCanvas *c1 =
new TCanvas(
"c1",
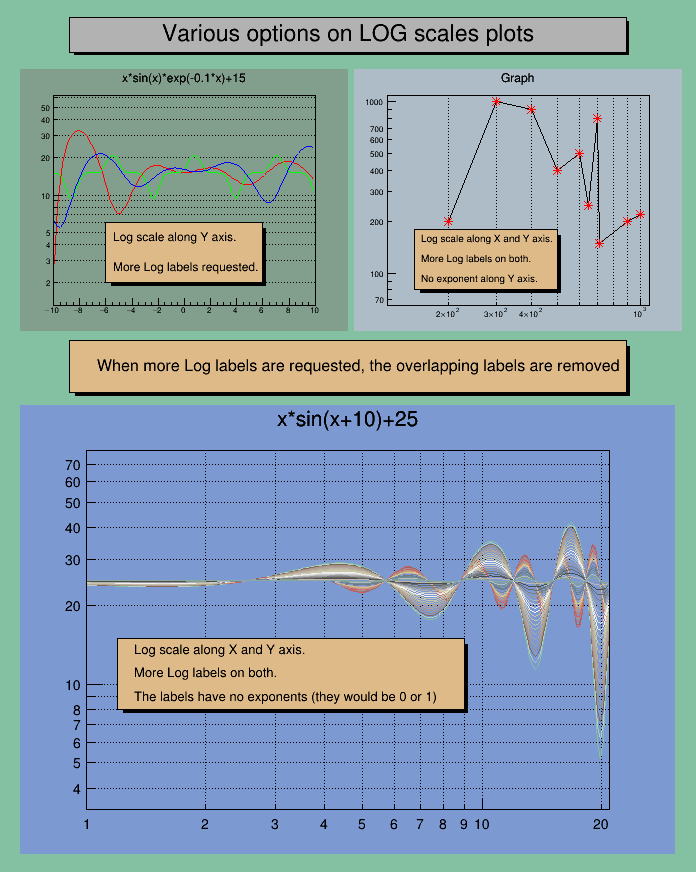
"Various options on LOG scales plots",0,0,700,900);
TPad *pad1 =
new TPad(
"pad1",
"pad1",0.03,0.62,0.50,0.92,32);
TPad *pad2 =
new TPad(
"pad2",
"pad2",0.51,0.62,0.98,0.92,33);
TPad *pad3 =
new TPad(
"pad3",
"pad3",0.03,0.02,0.97,0.535,38);
pave->
AddText(
"When more Log labels are requested, the overlapping labels are removed");
TF1 *f1 =
new TF1(
"f1",
"x*sin(x)*exp(-0.1*x)+15",-10.,10.);
TF1 *f2 =
new TF1(
"f2",
"(sin(x)+cos(x))**5+15",-10.,10.);
TF1 *f3 =
new TF1(
"f3",
"(sin(x)/(x)-x*cos(x))+15",-10.,10.);
pave1->
AddText(
"Log scale along Y axis.");
pave1->
AddText(
"More Log labels requested.");
double x[10] = { 200, 300, 400, 500, 600, 650, 700, 710, 900,1000 };
double y[10] = { 200, 1000, 900, 400, 500, 250, 800, 150, 201, 220 };
pave2->
AddText(
"Log scale along X and Y axis.");
pave2->
AddText(
"More Log labels on both.");
pave2->
AddText(
"No exponent along Y axis.");
TF1 *f4 =
new TF1(
"f4a",
"x*sin(x+10)+25",1,21);
f4 =
new TF1(
"f4b",
"x*cos(x+10)*sin(x+10)+25",1,21);
for (int i=a; i>=1; i--) {
f4 =
new TF1(
Form(
"f4b_%d",i),
"x*sin(x+10)*[0]/[1]+25",1,21);
f4 =
new TF1(
Form(
"f4c_%d",i),
"x*cos(x+10)*sin(x+10)*[0]/[1]+25",1,25);
}
pave3->
AddText(
"Log scale along X and Y axis.");
pave3->
AddText(
"More Log labels on both.");
pave3->
AddText(
"The labels have no exponents (they would be 0 or 1)");
}
- Author
- Olivier Couet
Definition in file logscales.C.

 ROOT 6.10/09 - Reference Guide Generated on Thu May 31 2018 12:11:11 using Doxygen 1.8.13.