Logo ROOT   6.10/09
Reference Guide
candleplot.C File Reference

Detailed Description

View in nbviewer Open in SWAN Example of candle plot with 2-D histograms.

pict1_candleplot.C.png
void candleplot() {
TRandom *rand = new TRandom();
TDatime *dateBegin = new TDatime(2010,1,1,0,0,0);
TDatime *dateEnd = new TDatime(2011,1,1,0,0,0);
TH2I *h1 = new TH2I("h1","Machine A + B",12,dateBegin->Convert(),dateEnd->Convert(),1000,0,1000);
TH2I *h2 = new TH2I("h2","Machine B",12,dateBegin->Convert(),dateEnd->Convert(),1000,0,1000);
h1->GetXaxis()->SetTimeFormat("%m/%y");
h1->GetXaxis()->SetTitle("Date [month/year]");
float Rand;
for (int i = dateBegin->Convert(); i < dateEnd->Convert(); i+=86400*30) {
for (int j = 0; j < 1000; j++) {
Rand = rand->Gaus(500+sin(i/10000000.)*100,50); h1->Fill(i,Rand);
Rand = rand->Gaus(500+sin(i/11000000.)*100,70); h2->Fill(i,Rand);
}
}
h1->SetBarWidth(0.4);
h1->SetBarOffset(-0.25);
h1->SetFillColor(kYellow);
h1->SetFillStyle(1001);
h2->SetBarWidth(0.4);
h2->SetBarOffset(0.25);
h2->SetLineColor(kRed);
h2->SetFillColor(kGreen);
TCanvas *c1 = new TCanvas();
h1->Draw("candle2");
h2->Draw("candle3 same");
gPad->BuildLegend(0.78,0.695,0.980,0.935,"","f");
}
Author
Georg Troska

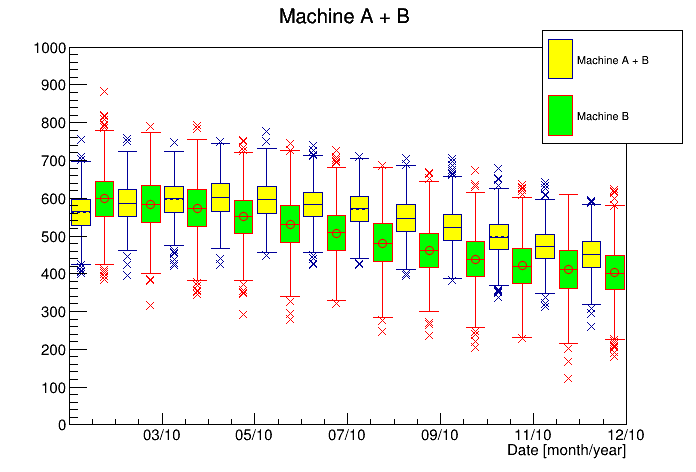
Definition in file candleplot.C.