Loading [MathJax]/extensions/tex2jax.js
Logo ROOT   6.08/07
Reference Guide
All Classes Namespaces Files Functions Variables Typedefs Enumerations Enumerator Properties Friends Macros Modules Pages
xyplot.C File Reference

Detailed Description

View in nbviewer Open in SWAN Example showing how to produce a plot with an orthogonal axis system centered at (0,0).

pict1_xyplot.C.png
void xyplot()
{
TCanvas *c = new TCanvas("c","XY plot",200,10,700,500);
// Remove the frame
// Define and draw a curve the frame
const Int_t n = 4;
Double_t x[n] = {-1, -3, -9, 3};
Double_t y[n] = {-1000, 900, 300, 300};
gr = new TGraph(n,x,y);
gr->SetTitle("XY plot");
gr->SetMinimum(-1080);
gr->SetMaximum(1080);
gr->SetLineColor(kRed);
gr->Draw("AC*");
// Remove the frame's axis
gPad->Update();
// Draw orthogonal axis system centered at (0,0).
// Draw the Y axis. Note the 4th label is erased with SetLabelAttributes
TGaxis *yaxis = new TGaxis(0, gPad->GetUymin(),
0, gPad->GetUymax(),
gPad->GetUymin(),gPad->GetUymax(),6,"+LN");
yaxis->ChangeLabel(4,-1,0.);
yaxis->Draw();
// Draw the Y-axis title.
TLatex *ytitle = new TLatex(-0.5,gPad->GetUymax(),"Y axis");
ytitle->Draw();
ytitle->SetTextSize(0.03);
ytitle->SetTextAngle(90.);
ytitle->SetTextAlign(31);
// Draw the X axis
TGaxis *xaxis = new TGaxis(gPad->GetUxmin(), 0,
gPad->GetUxmax(), 0,
gPad->GetUxmin(),gPad->GetUxmax(),510,"+L");
xaxis->Draw();
// Draw the X axis title.
TLatex *xtitle = new TLatex(gPad->GetUxmax(),-200.,"X axis");
xtitle->Draw();
xtitle->SetTextAlign(31);
xtitle->SetTextSize(0.03);
}
Author
Olivier Couet

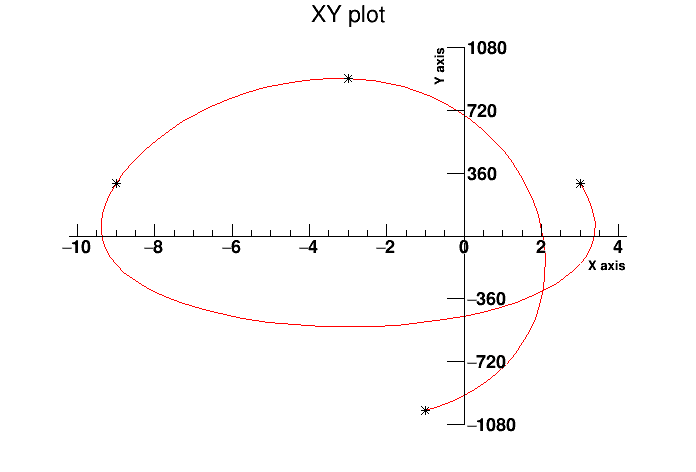
Definition in file xyplot.C.