 |
ROOT
Reference Guide |

|
| |
ROOT
Reference Guide |
|
ROOT histograms implement the Unified Histogram Interface (UHI), enhancing interoperability with other UHI-compatible libraries. This compliance standardizes histogram operations, making tasks like plotting, indexing, and slicing more intuitive and consistent.
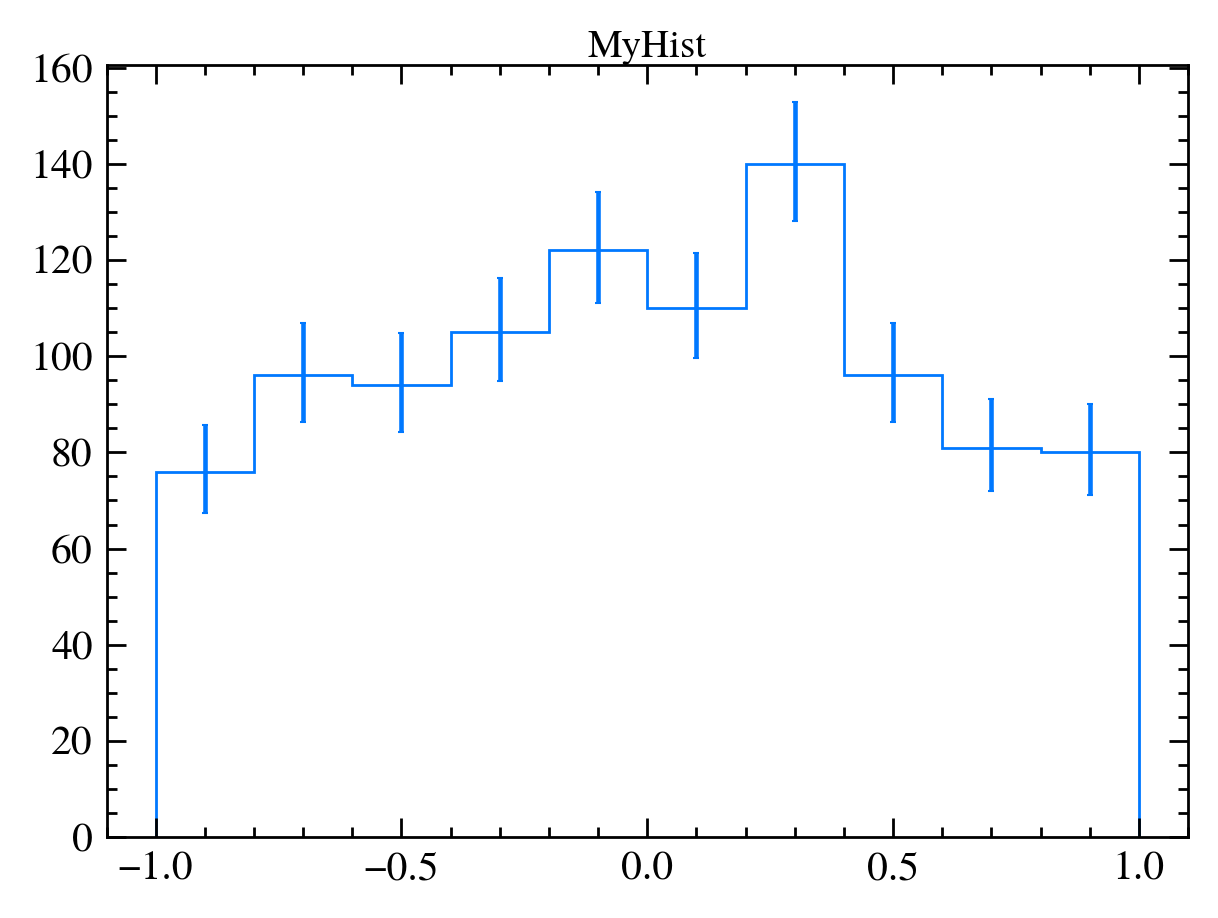
ROOT histograms implement the PlottableHistogram protocol. Any plotting library that accepts an object that follows the protocol can plot ROOT histogram objects.
You can read more about the protocol on the UHI plotting page.
TH1-derived classes (that includes TH2 and TH3).PlottableHistogram objects, you can call .values() on your histogram to retrieve a numpy.ndarray and pass it to appropriate plotting functions.matplotlib.pyplot.imshow and seaborn.heatmap: 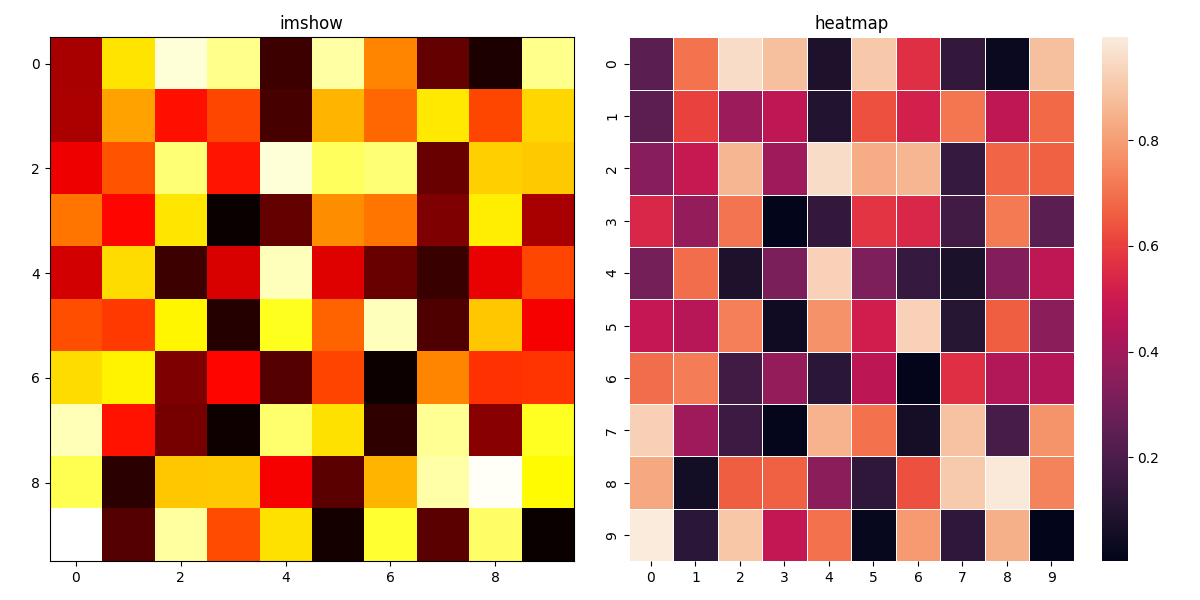
ROOT histograms implement the UHI indexing specification. This introduces a unified syntax for accessing and setting bin values, as well as slicing histogram axes.
You can read more about the syntax on the UHI Indexing page.
The loc, undeflow, overflow, rebin and sum tags are imported from the ROOT.uhi module.
nbins+1 where 0 is the underflow bin and nbins+1 is the overflow (see conventions for numbering bins). In contrast, UHI inherits 0-based indexing from numpy array conventions where 0 is the first valid element and n-1 is the last valid element. Our implementation complies with the UHI conventions by implementing the following syntax:h[underflow] returns the underflow bin (equivalent to h.GetBinContent(0)).h[0] returns the first valid bin (equivalent to h.GetBinContent(1)).h[-1] returns the last valid bin (equivalent to h.GetBinContent(nbins)).h[overflow] returns the overflow bin (equivalent to h.GetBinContent(nbins+1)).sumans = h[a:b:sum] --> ans is the integral value.